


Simplify Statistical Data Presentation for Analysis!

How to perfectly present complex statistical data? Check out SurveyCake’s analysis features!
How to effectively analyze the survey data collected? SurveyCake provides two ways to present survey results: “Chart Report” and “Data Report”, displayed in real-time in the survey backend, allowing in-depth exploration of feedback content, eliminating the hassle of dealing with large response data!
I. Chart Report
1.Chart Report
On the survey dashboard, click on any survey to enter its backend. The first page displayed in the backend is the “Chart Report”. On this page, real-time statistical results for each question in the survey are displayed, and corresponding analysis charts are generated based on the question type.
On the right side of the image are the statistical charts visualizing the data. When the cursor hovers to the chart, real-time statistical results including numbers and proportions are displayed.
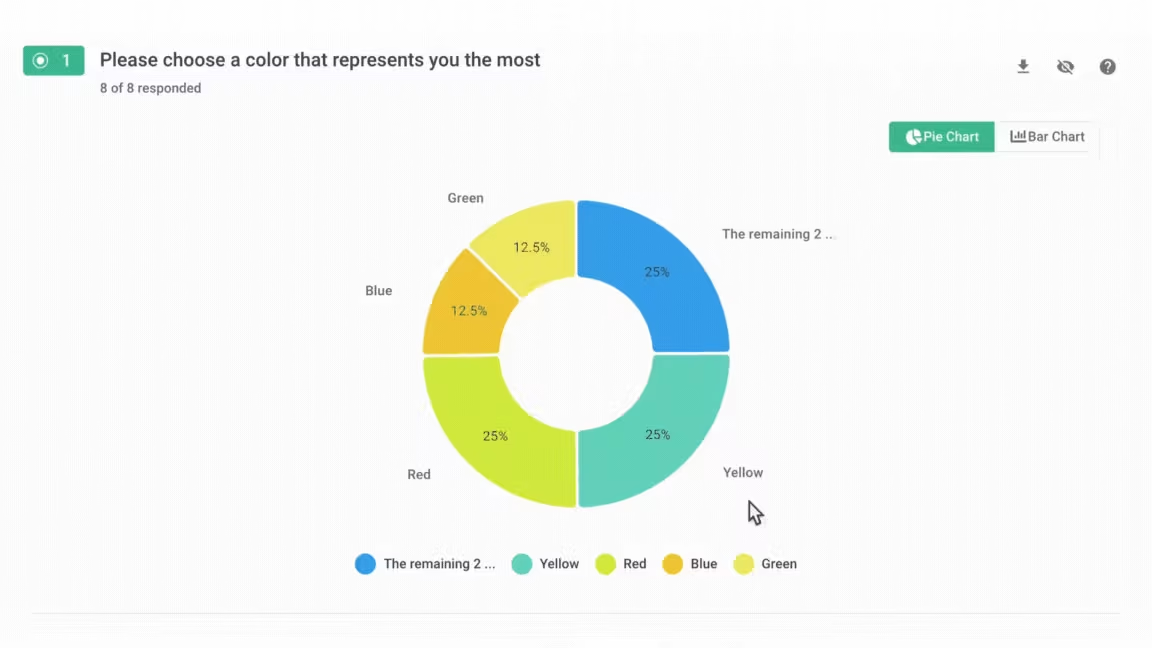
Have you noticed the update of the backend statistical charts? In the past, the chart presentation had many colors, visually appearing more complex and difficult to read. After optimization and updates, now the pie chart can display the complete names, percentages, and color blocks of up to four options, and automatically merge after the fifth option, providing more suitable charts and readability.
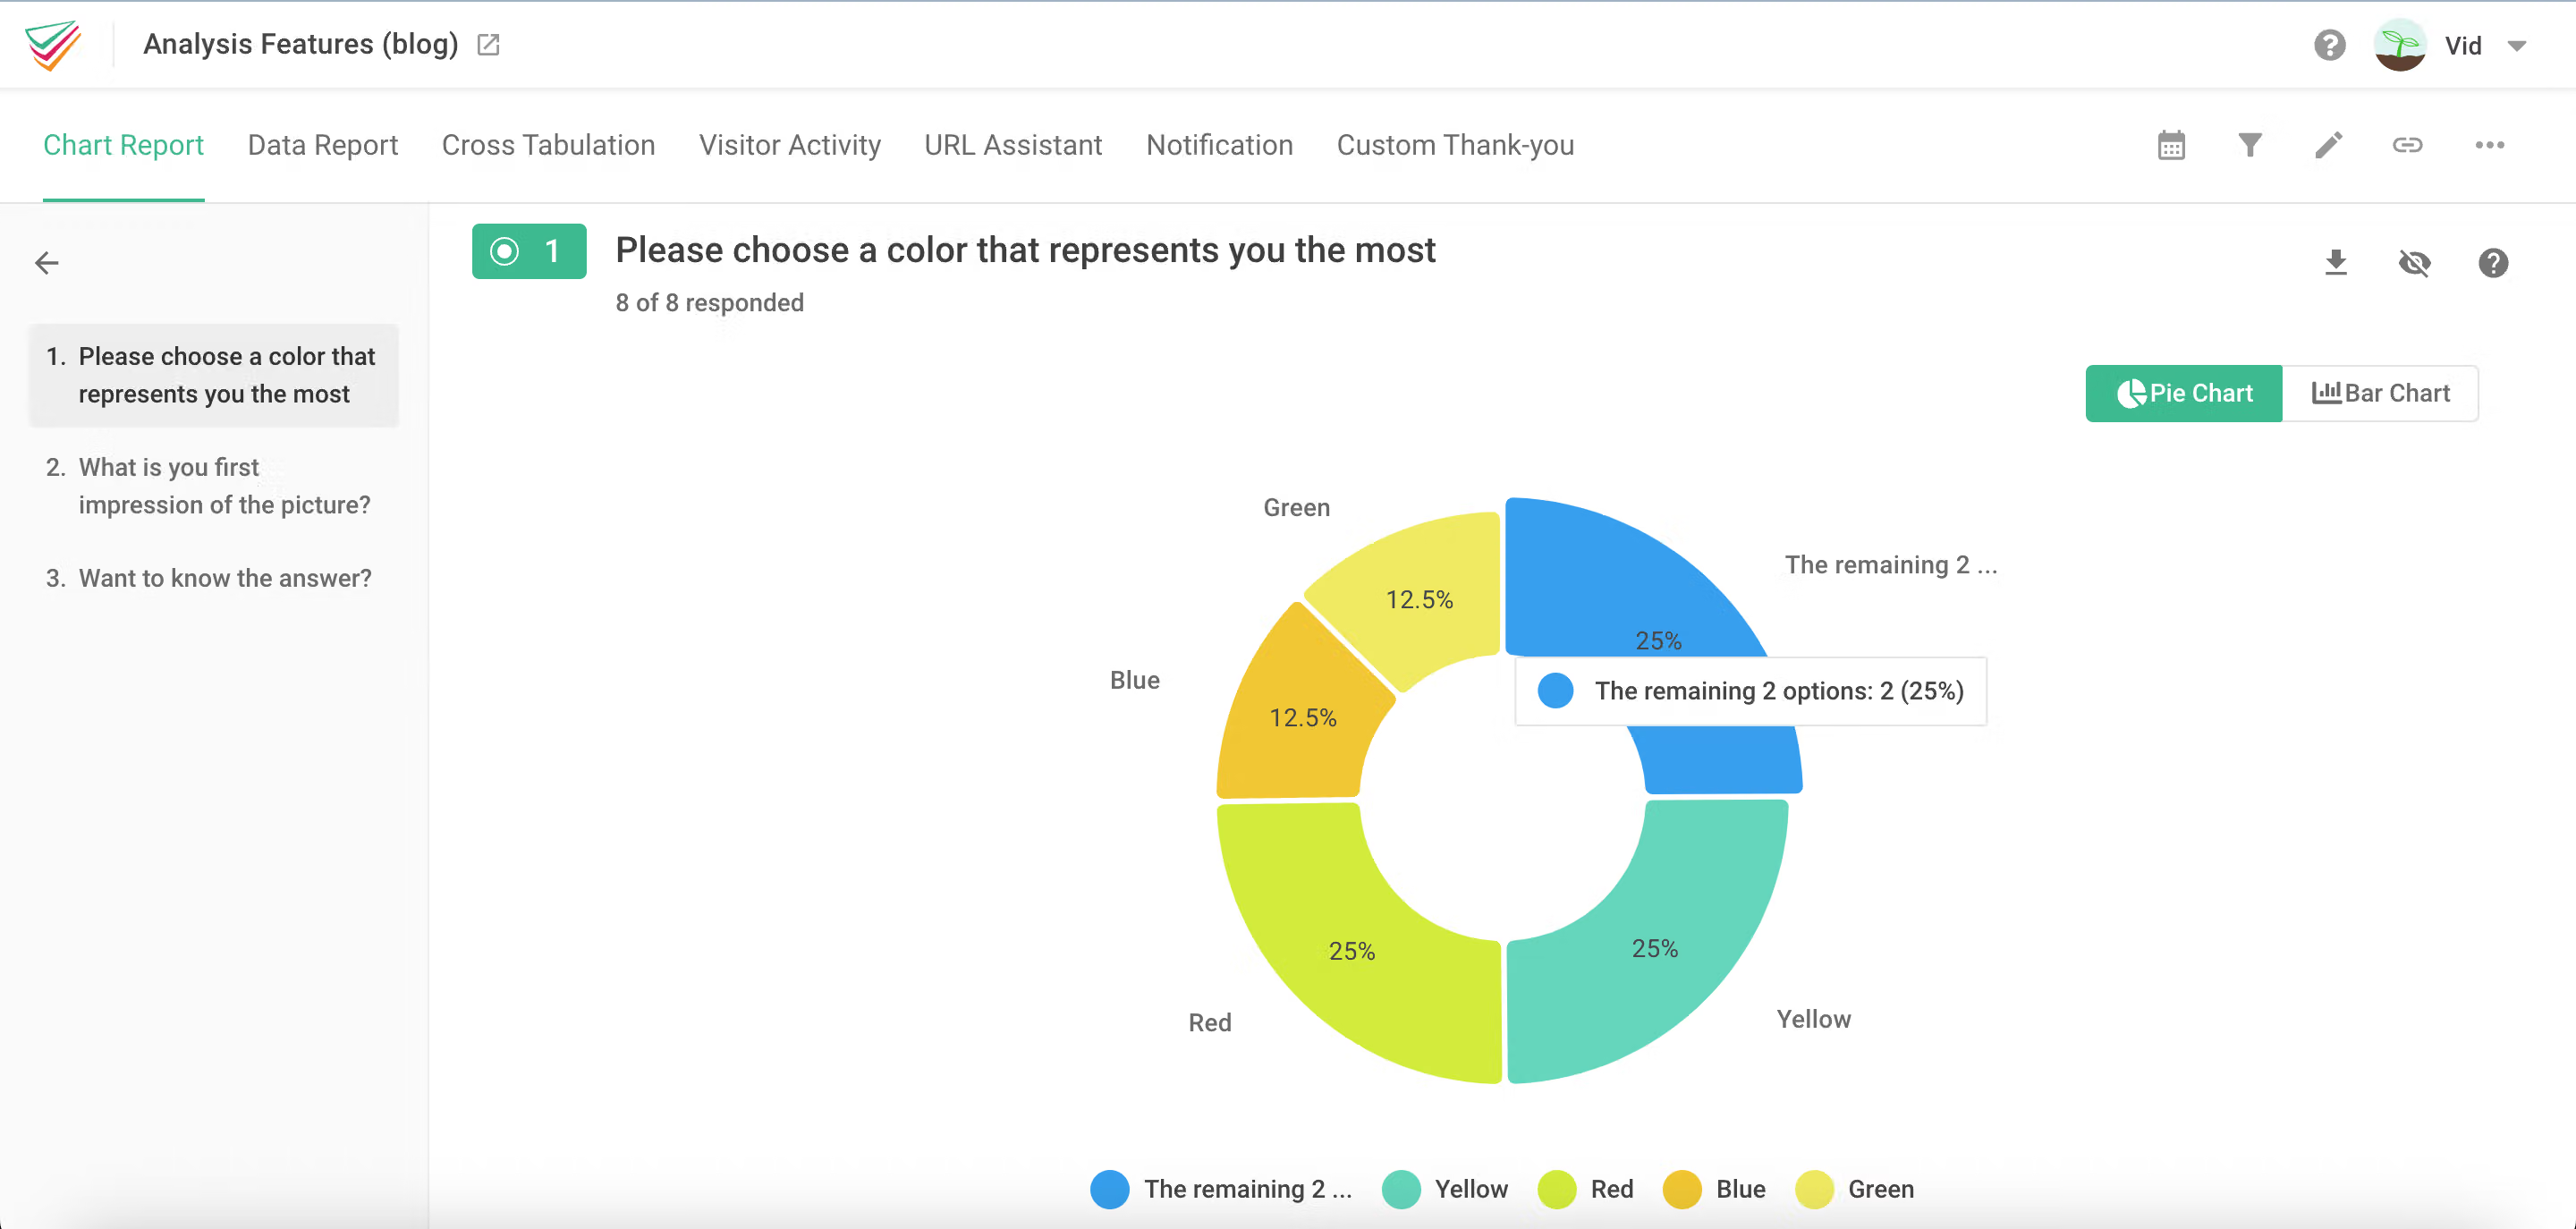
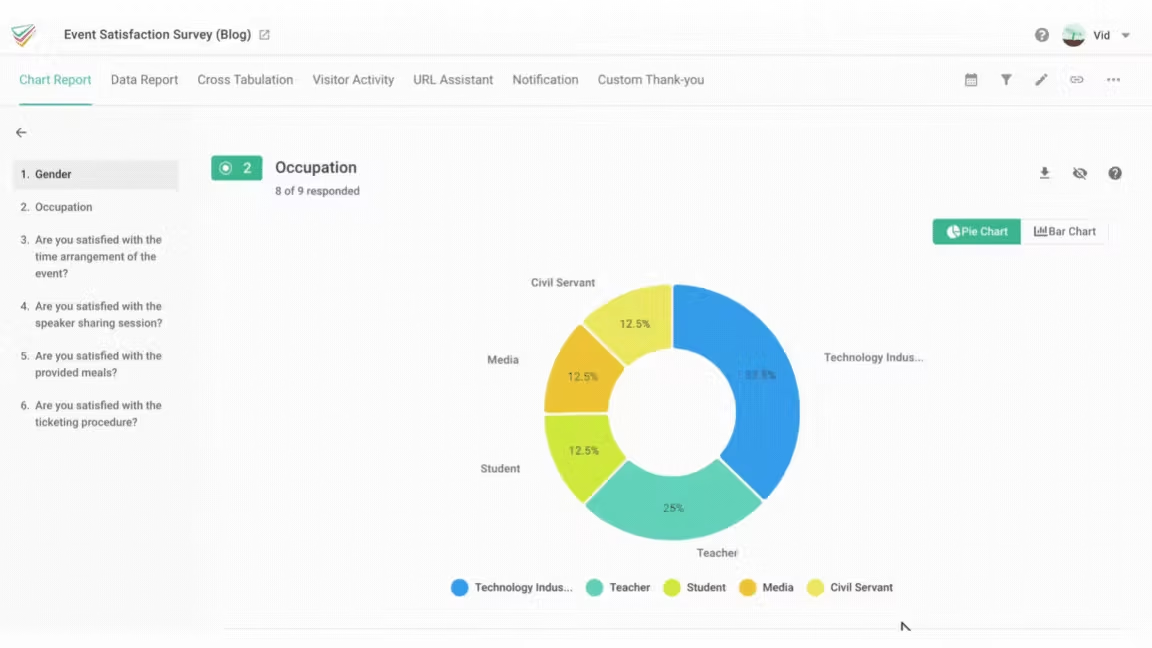
In addition, a navigation page has been added to the left side of the backend. If the survey has many questions, you can directly reach the statistical chart information of a specific question by clicking on the navigation column question. The data table under the statistical chart can also be collapsed, allowing efficient browsing of chart data even when there are many questions.
Different question types have their corresponding statistical charts, and for question types with more than two charts, you can click the icon in the upper right corner to automatically switch chart types.
2.Share Survey Charts
In addition to allowing creators to view the statistical charts of the survey, you can also share them with others through links! Click on “Share charts” in the toolbar at the top of the survey backend, copy the link, and share the statistical charts of the survey with others.
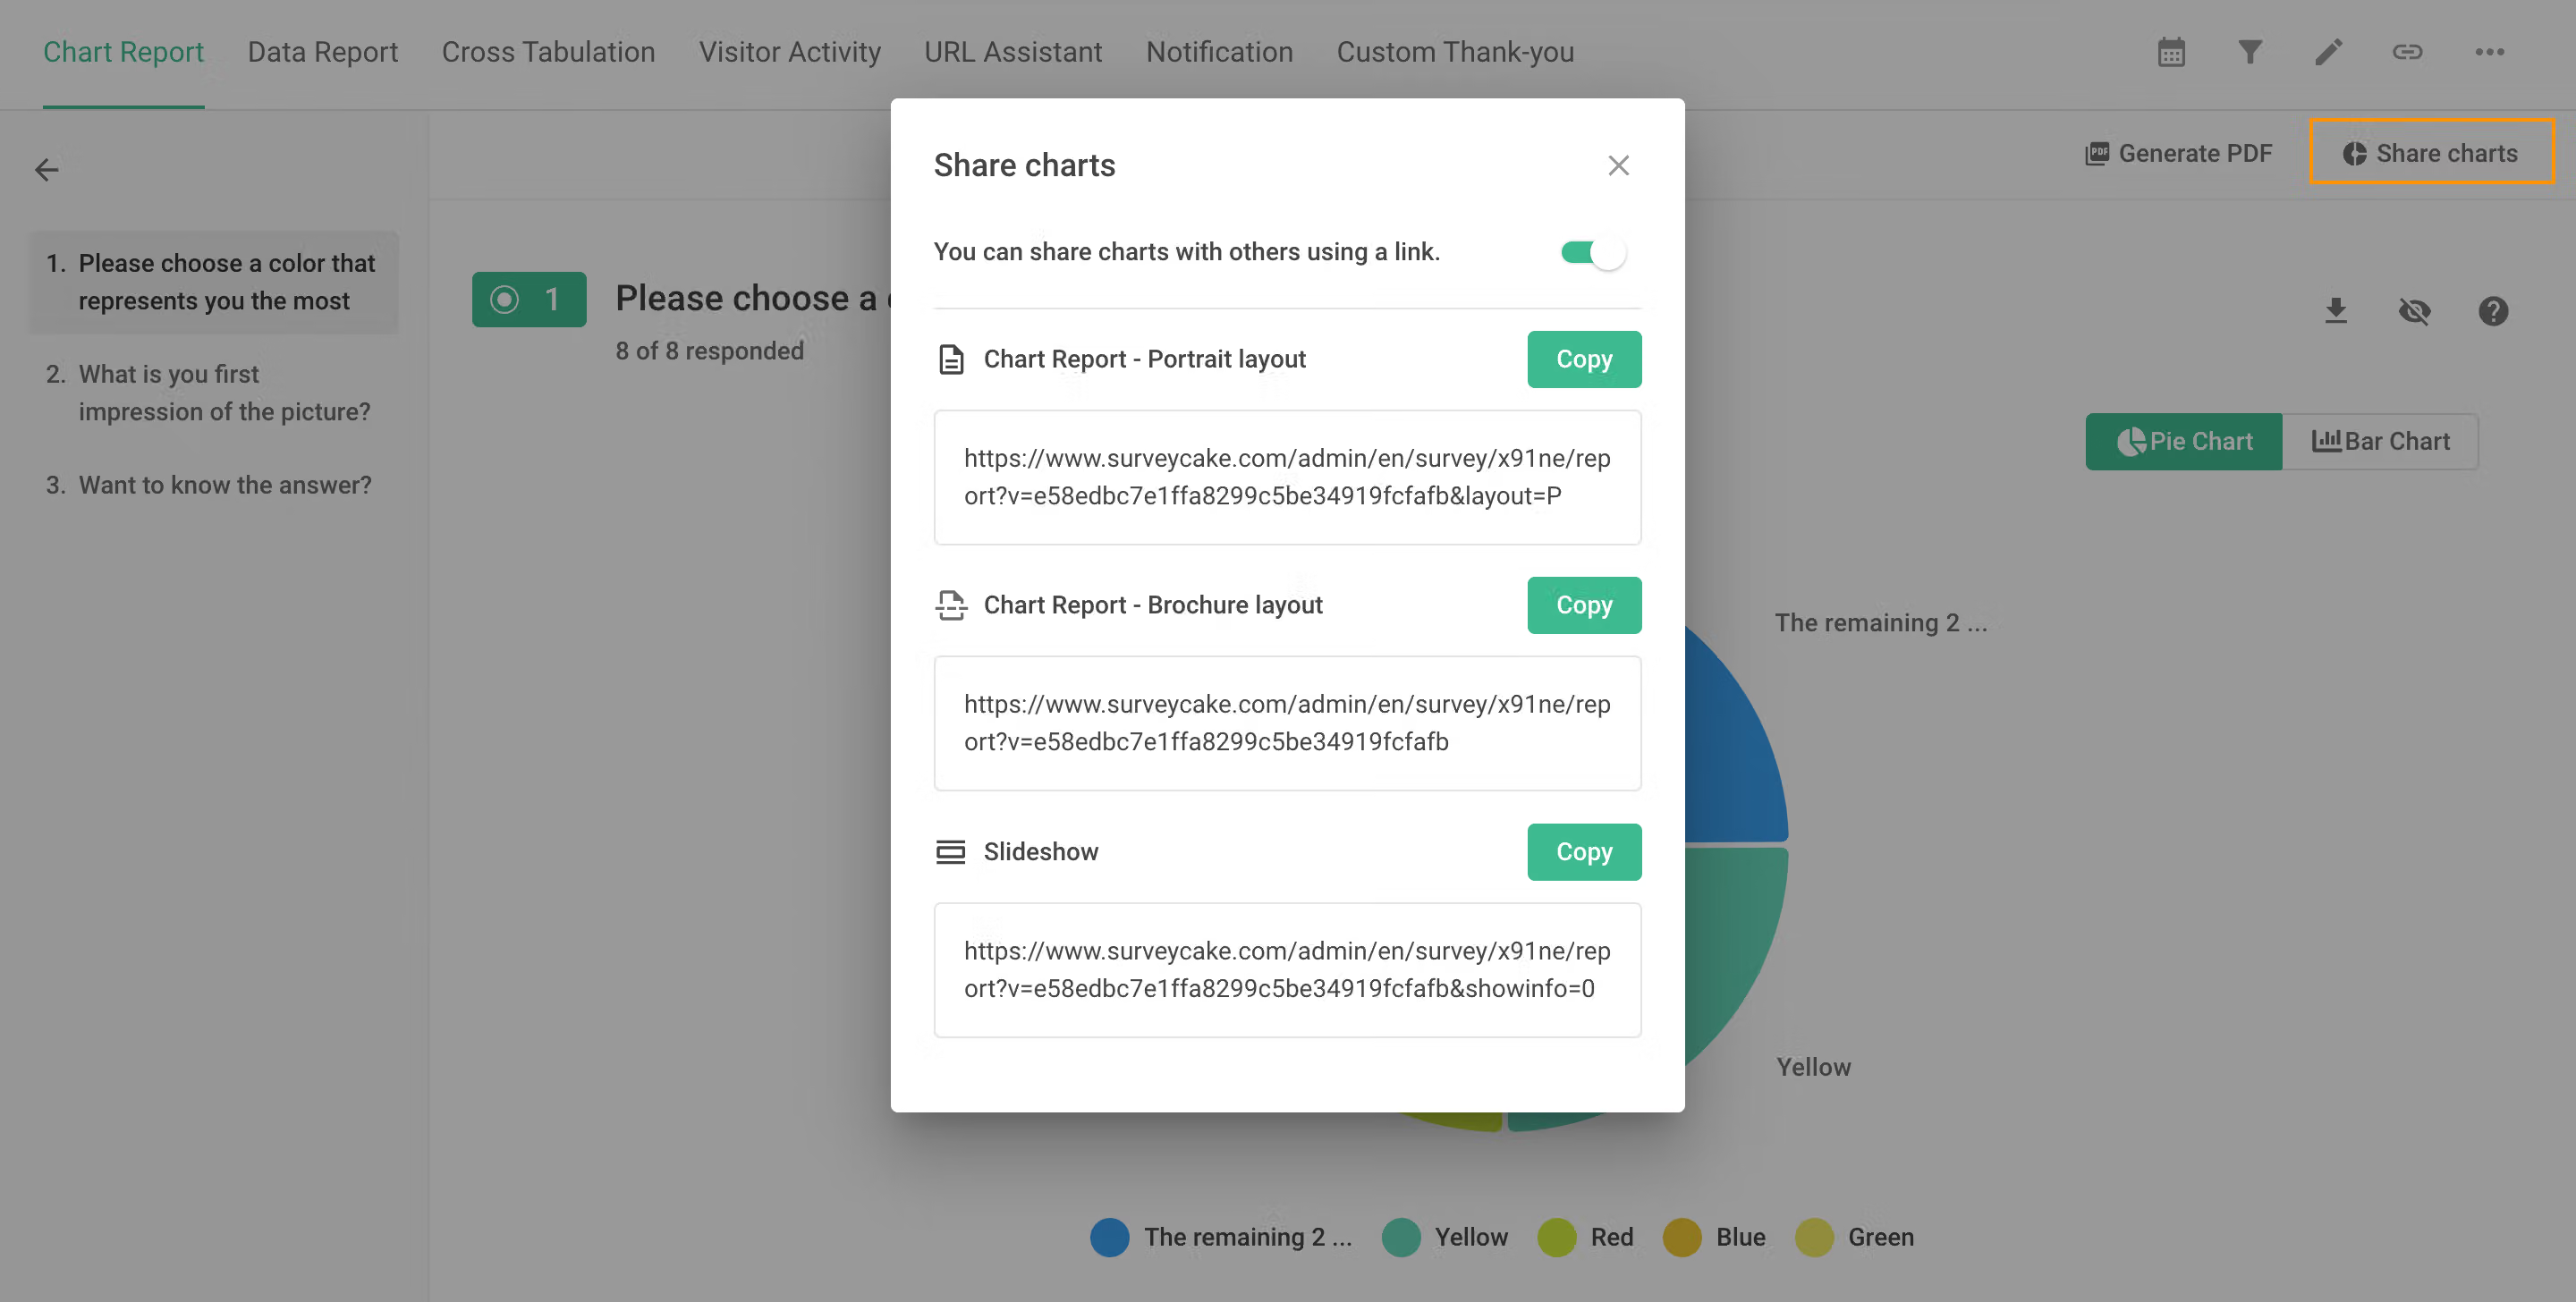
There are three types of templates available for sharing:
- Portrait Layout: all charts are included on the same page
- Brochure Layout: one chart per page
- Slideshow mode: directly project statistical charts of various questions on the full screen, suitable for presentation
On the left side of the “Share charts” feature, there is a “Generate PDF” function. In the past, exporting PDFs could only export all charts and was prone to formatting issues. Now, you can only export the charts you need! Hide the questions you don’t need by clicking the eye symbol next to them.
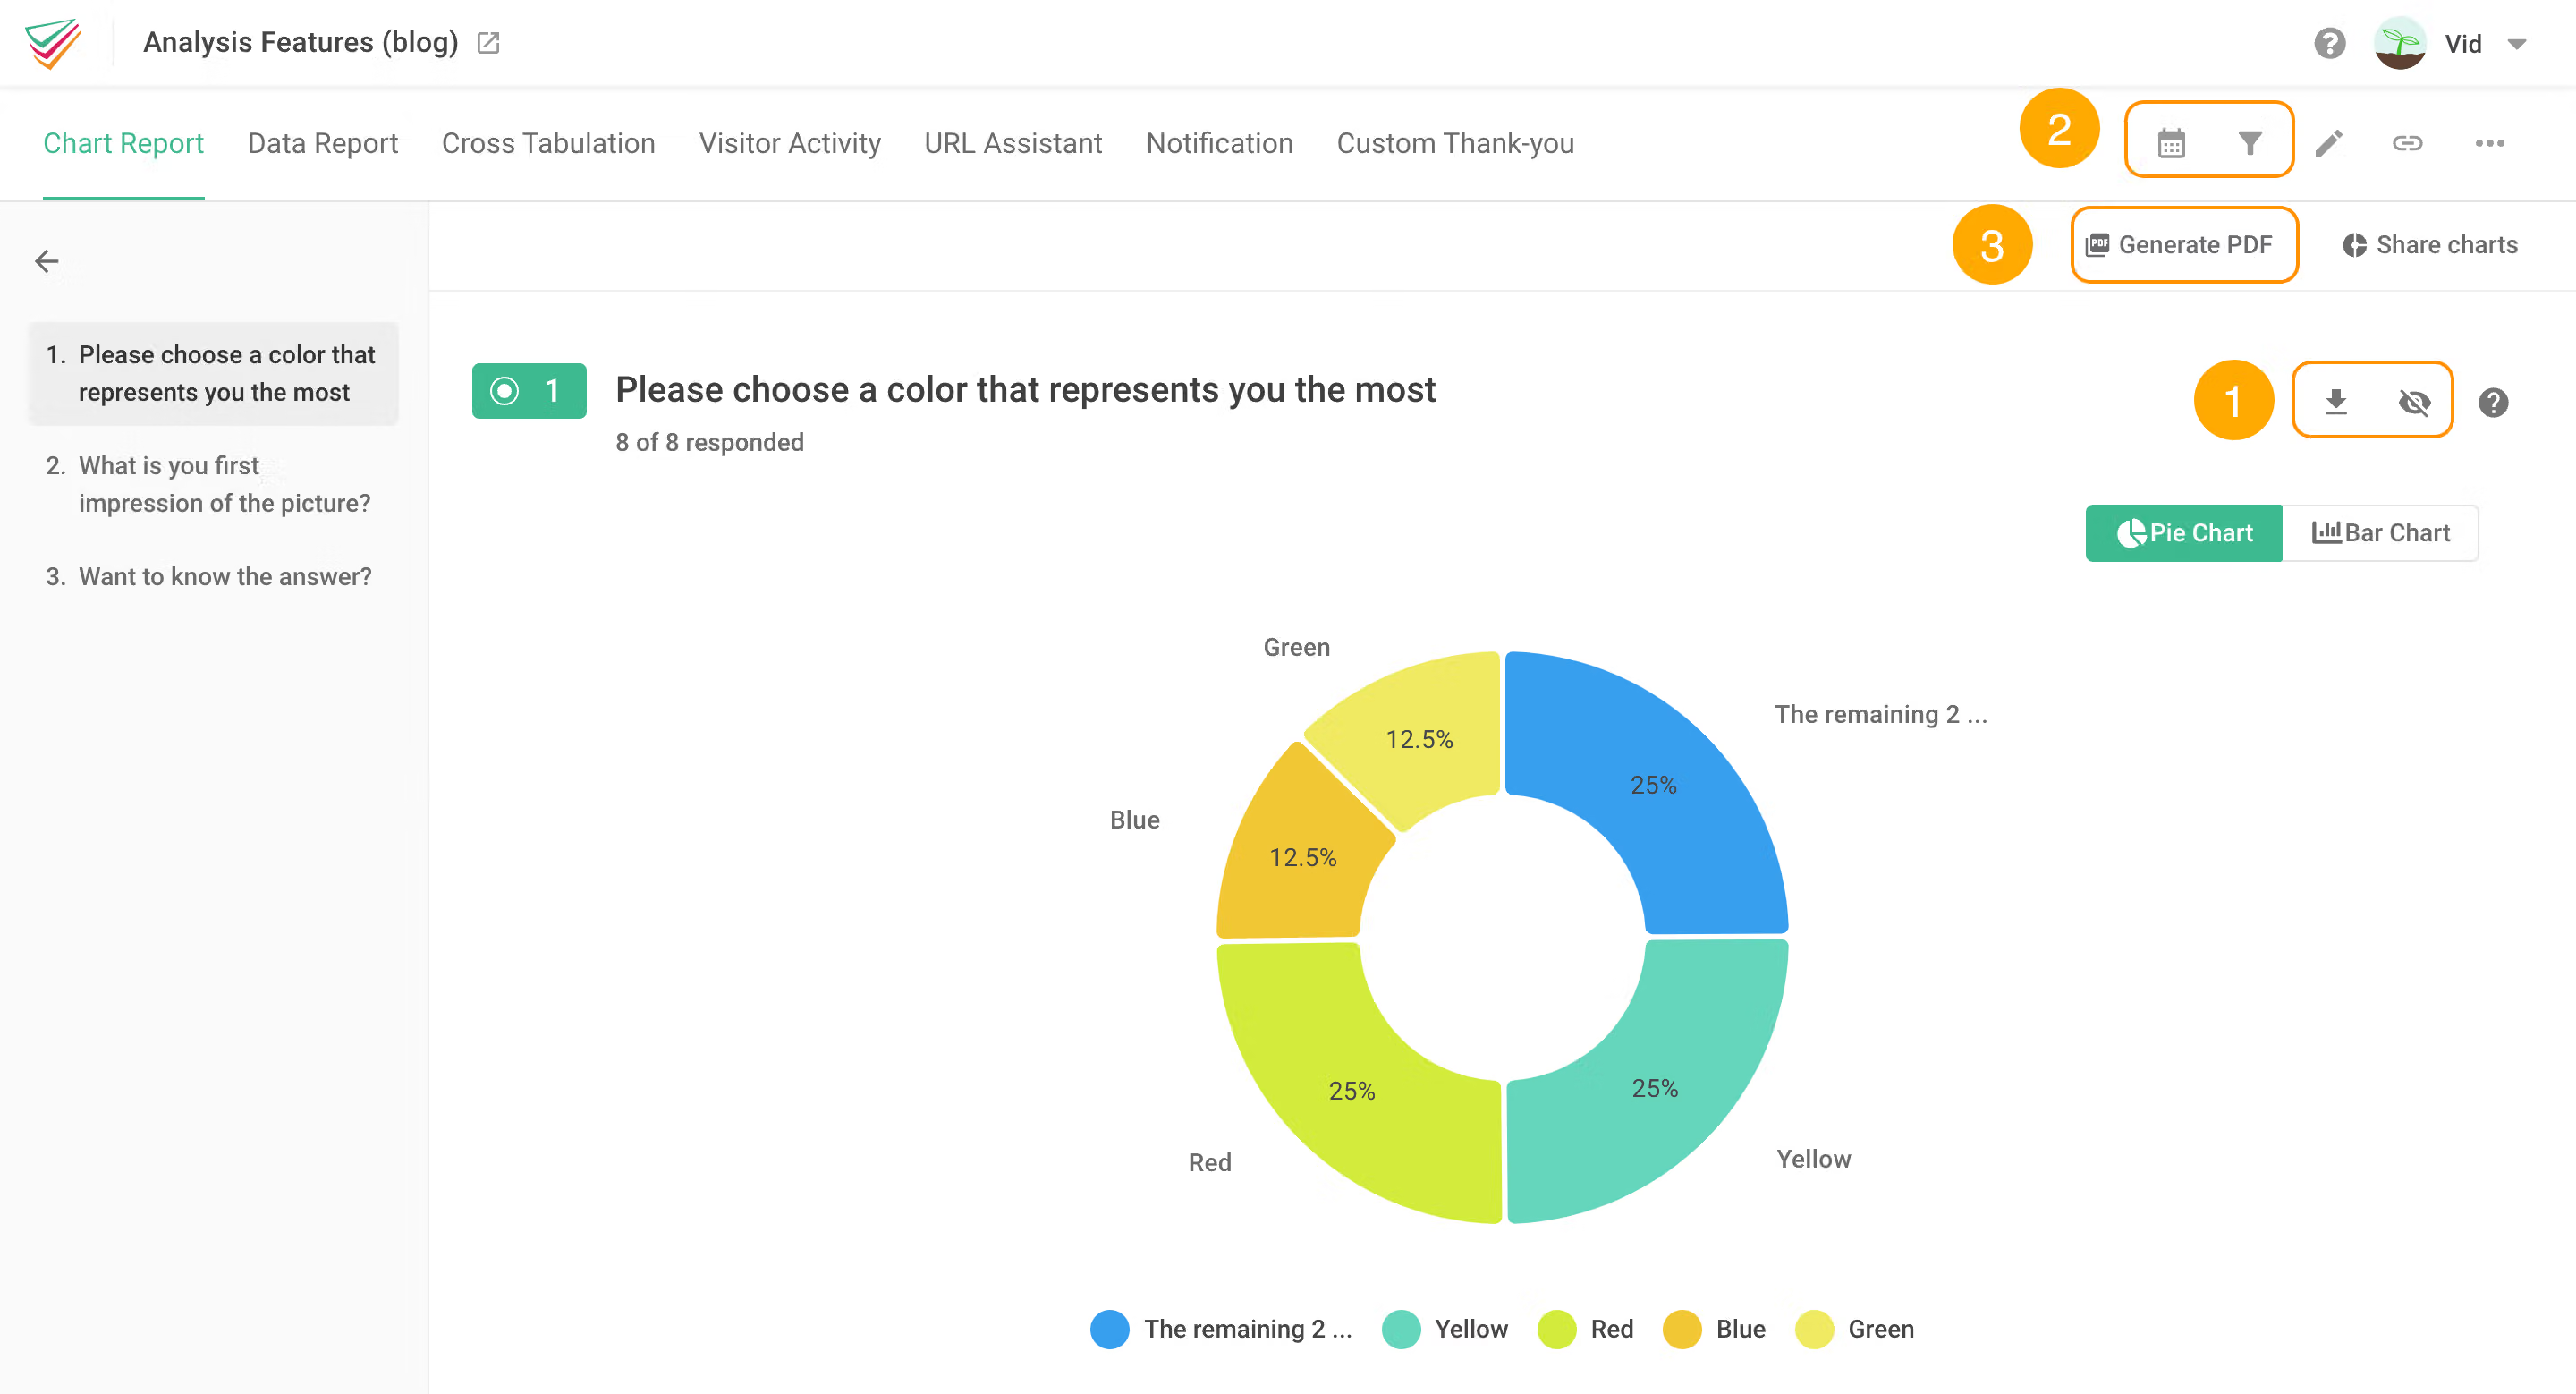
If you only need a specific chart, you can also download it by clicking the download symbol next to the question! (Number ①)
Sometimes you may only need data from a specific period or under specific conditions. You can use the “Date Filter” and “Filter” functions (Number ②) on the top right of the screen to filter out data according to specific filtering requirements, then click “Generate PDF” (Number 3 ③), and only the charts you need will be exported!
II. Data Report
1.Data Report
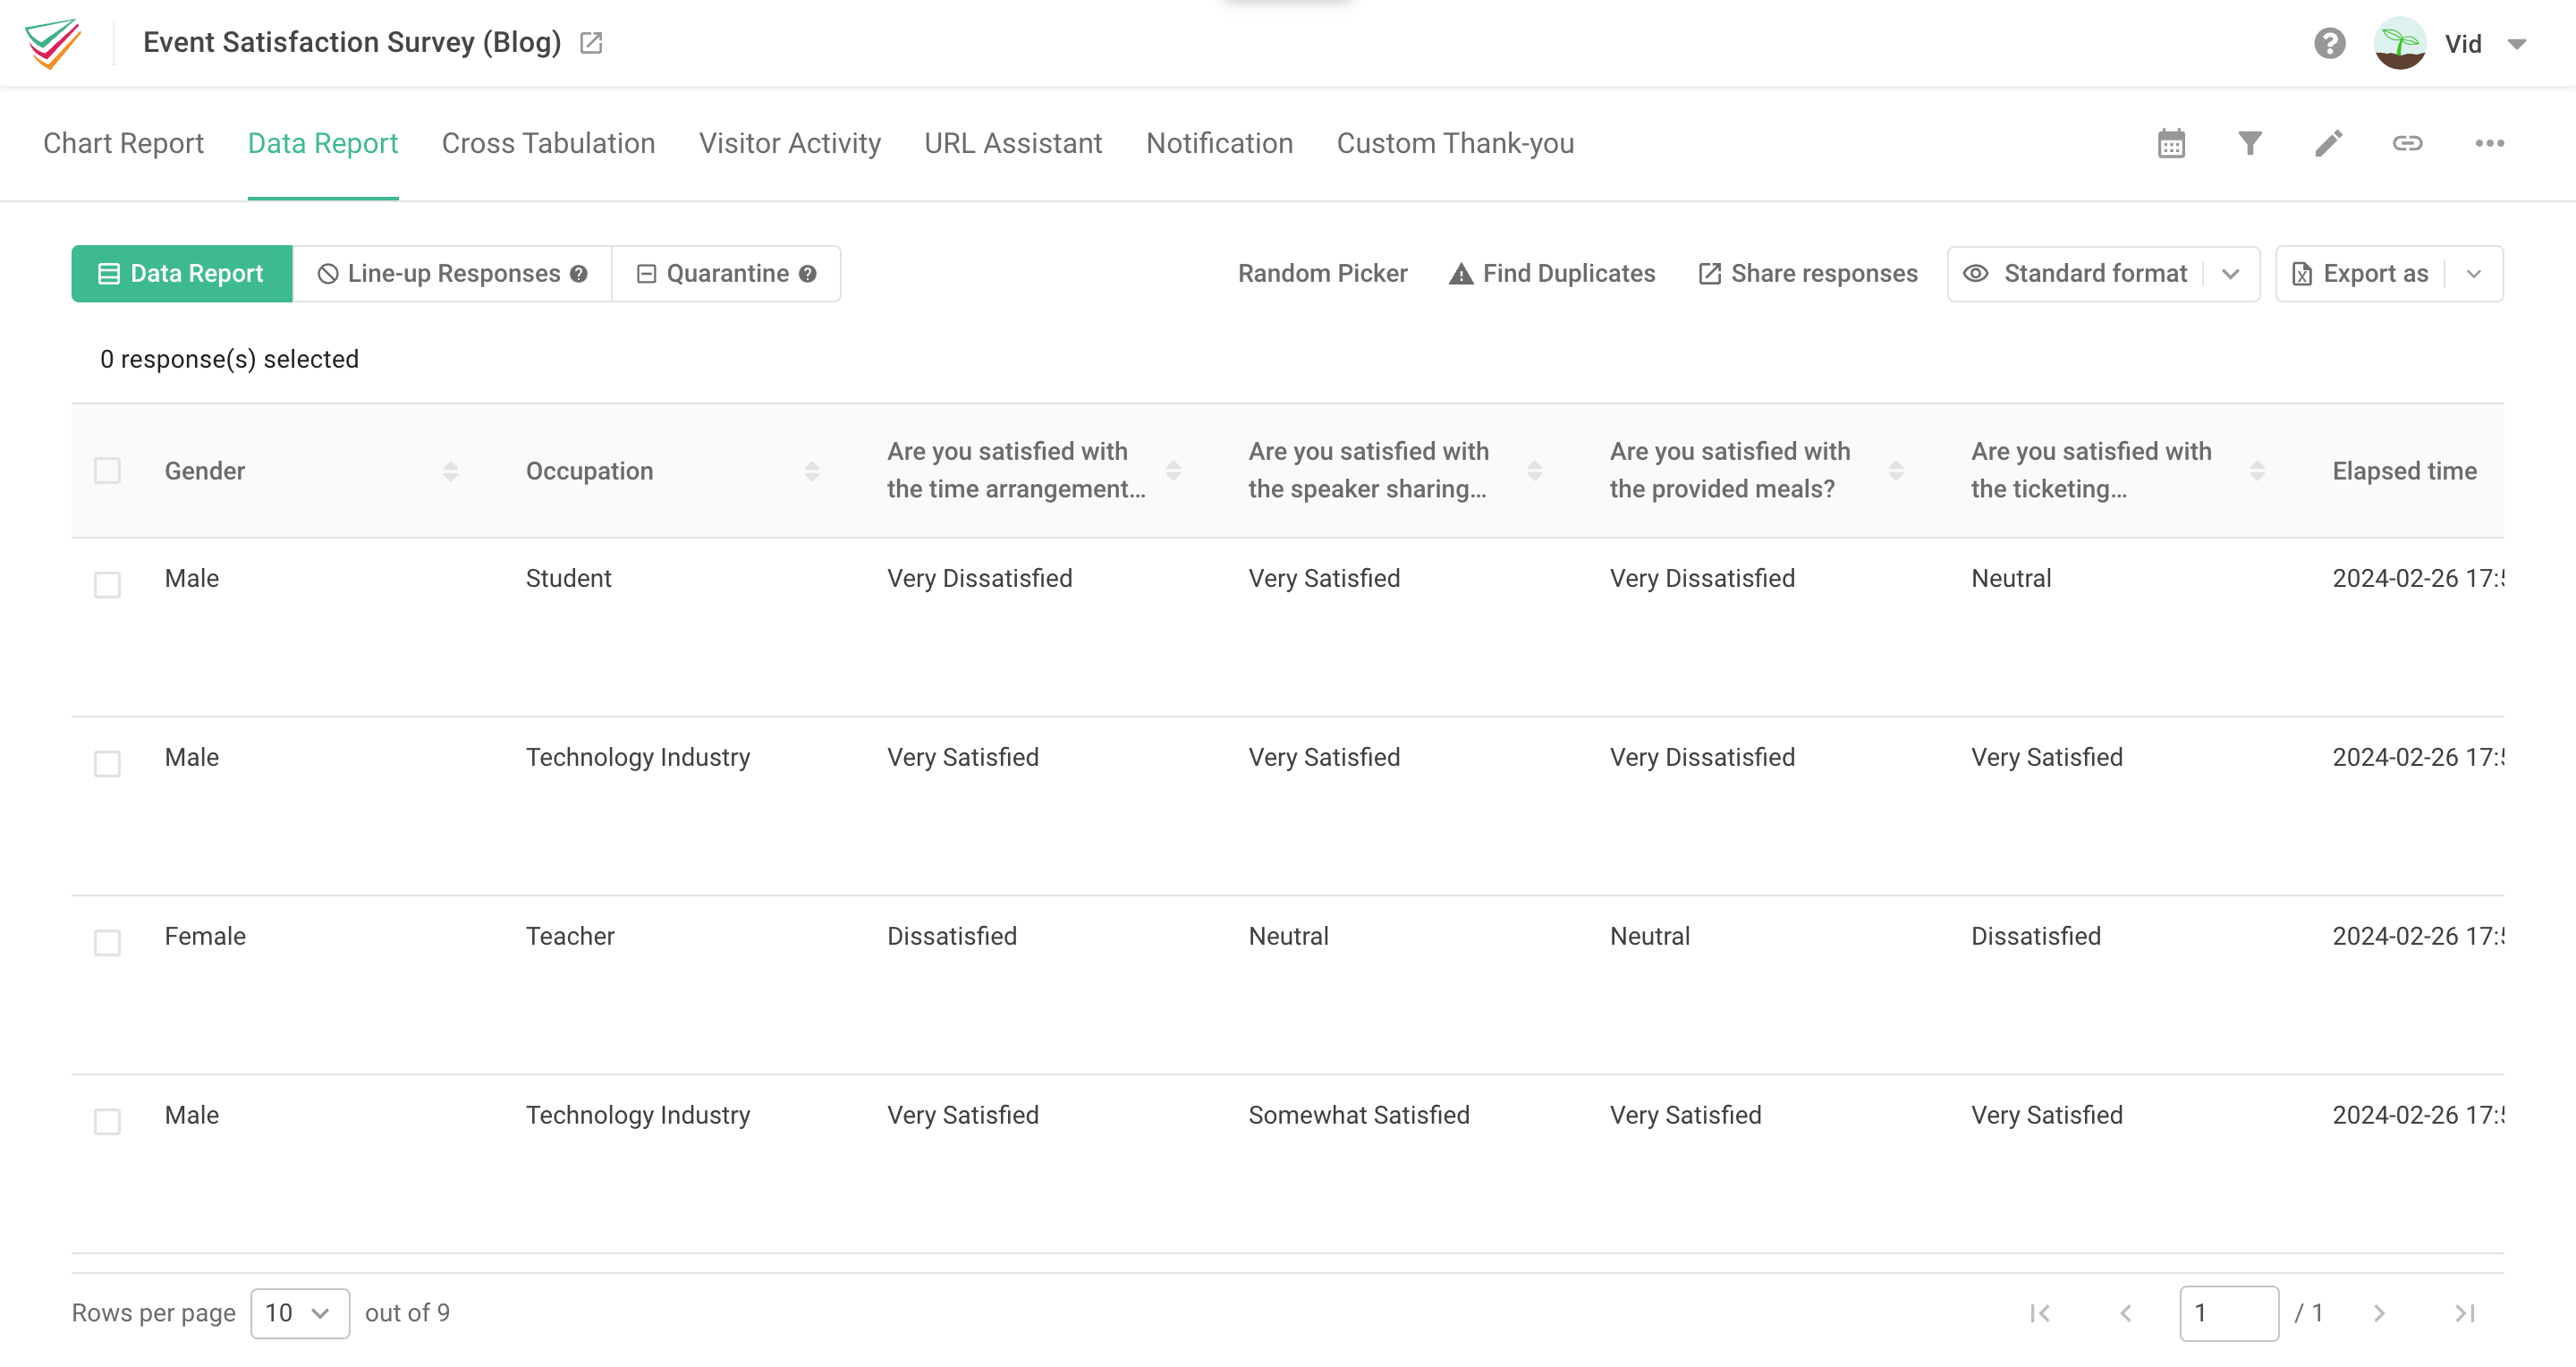
In addition to statistical charts, when conducting survey analysis, detailed responses are also crucial. SurveyCake allows you to browse data, specify sorting, delete data, convert browsing, and directly download Excel or SPSS files for further professional analysis or data retention through “Data Report”!
In “Data Report”, the details of each response are clearly presented.
2. Filter
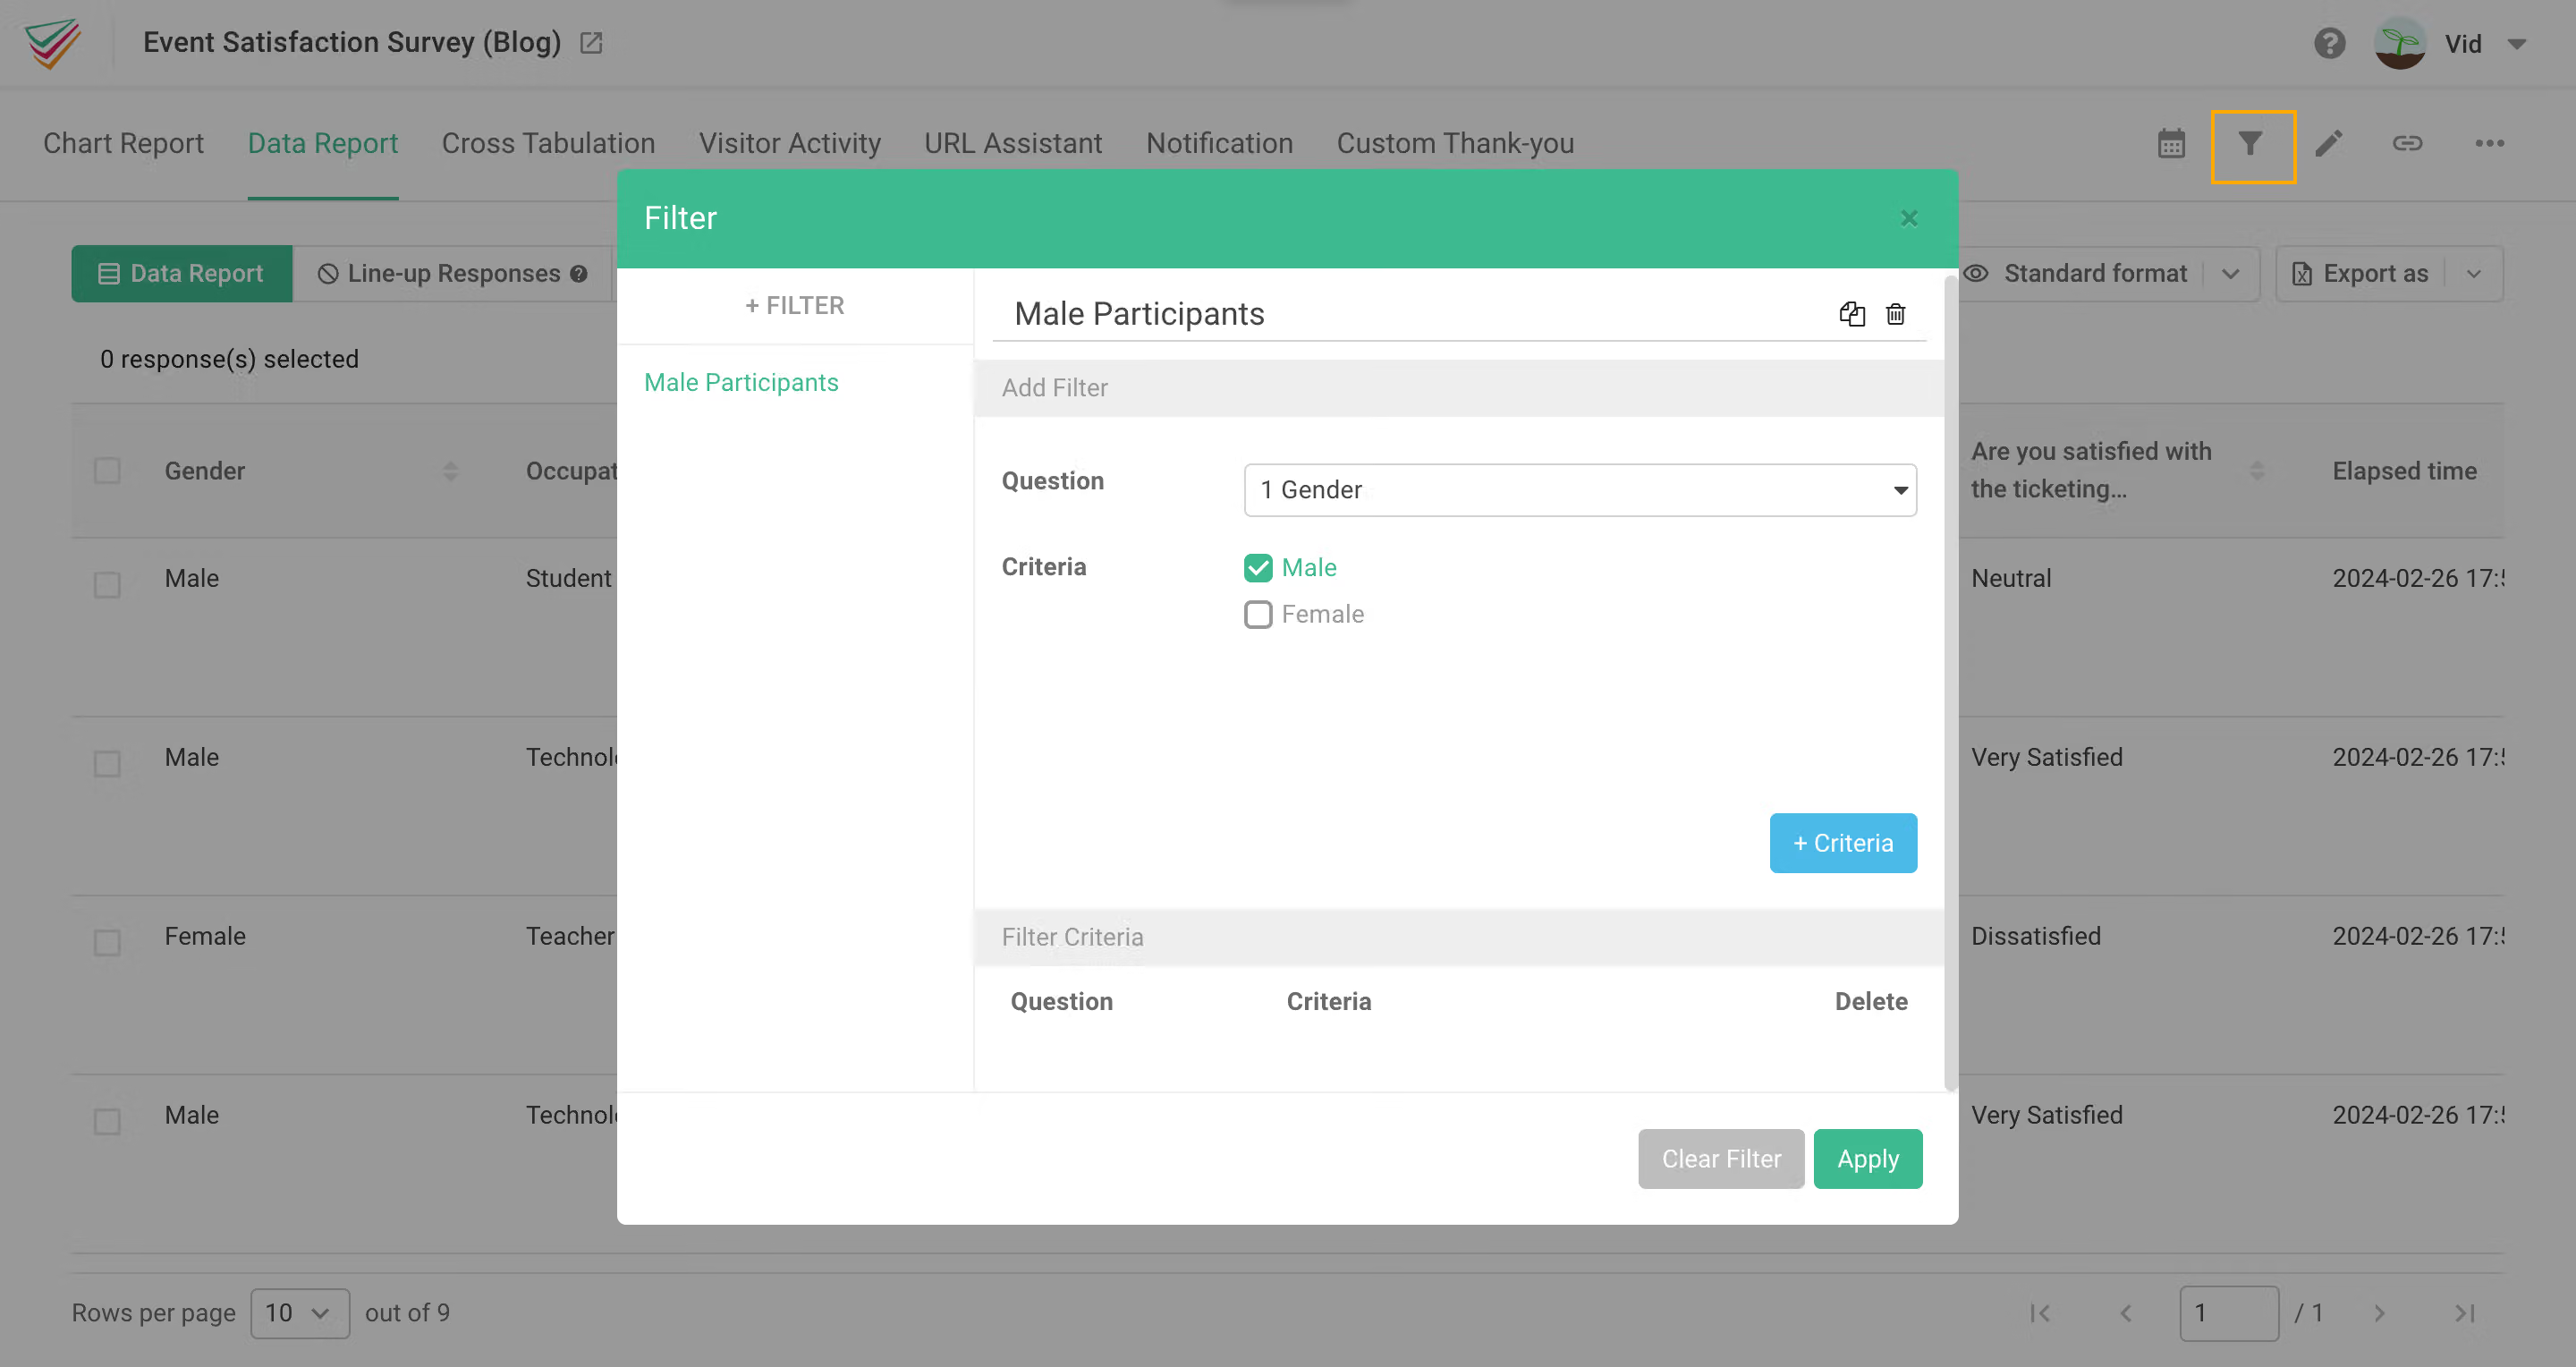
Similarly, “Data Report” can also use the “Filter” feature provided by SurveyCake’s backend to perform preliminary filtering and classification of data! After setting the filtering conditions (multiple conditions can be set simultaneously), all response details that meet the conditions will be listed, making it easy to break down large amounts of data.
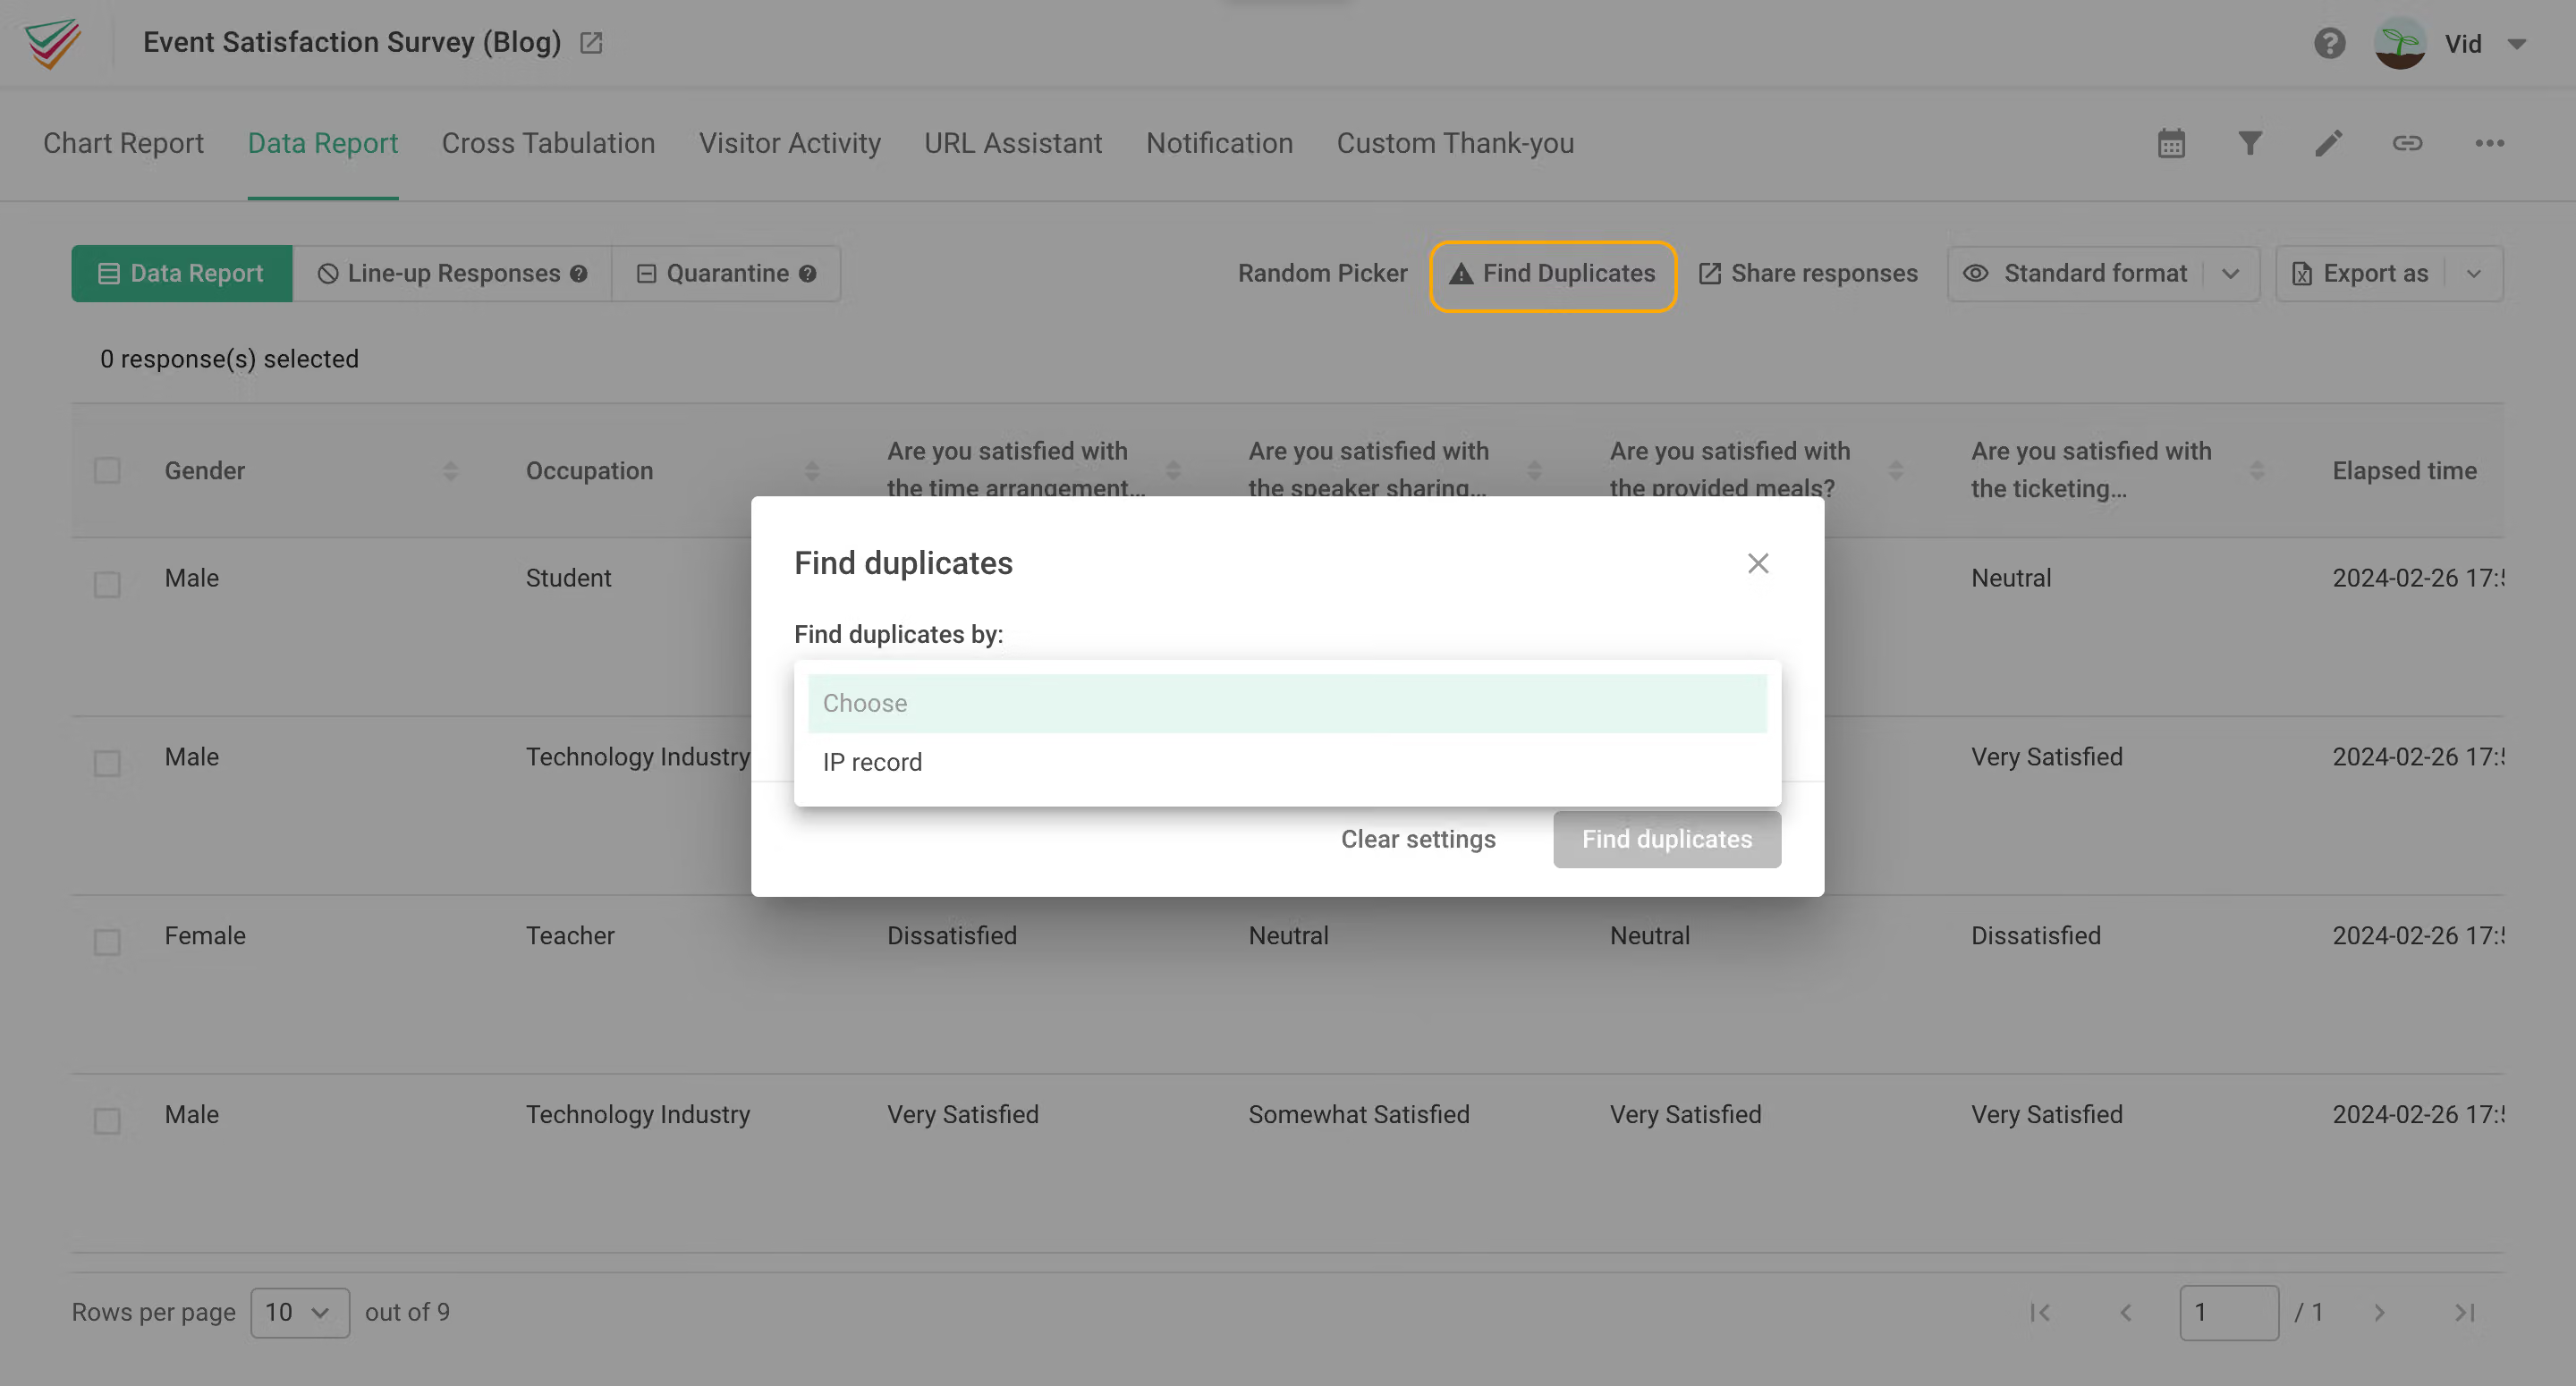
In addition, you can use “Find Duplicates” to filter answers, comparing duplicate responses (such as duplicate names, email , IP records, etc.).
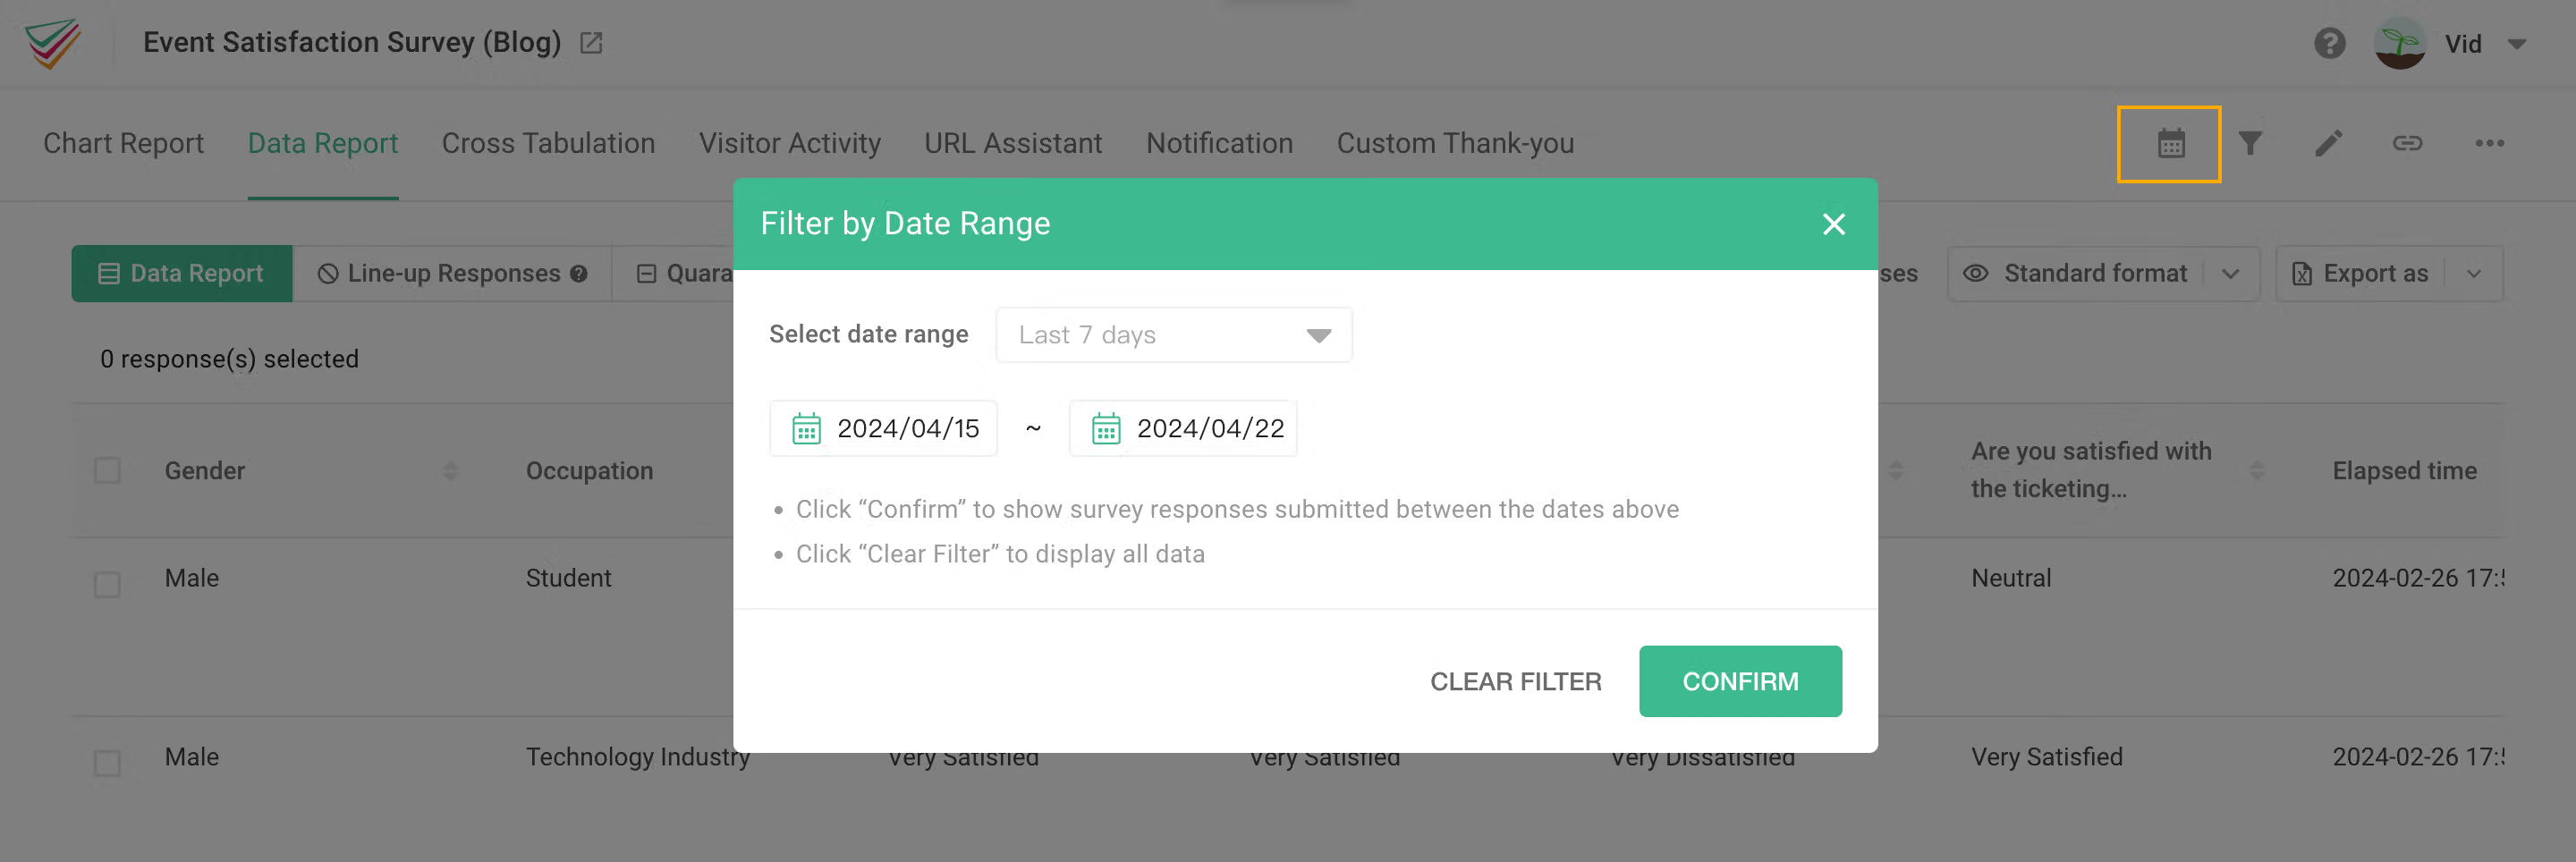
3. Date Filter
If you want to know the details of surveys within a specific period, you can use the “Date Filter” function to filter out forms filled out within a specific time period.
Of course, survey details can also be easily shared with others via links!
4. Cross Tabulation
“Cross Tabulation” can help you compare the relationship between two variables and generate cross-comparison tables.
Taking satisfaction surveys as an example, you can choose “Age” and “Source Channel of Brand Information” in the survey as variables for analysis. This way, you can easily see the sources of product information for different age groups!
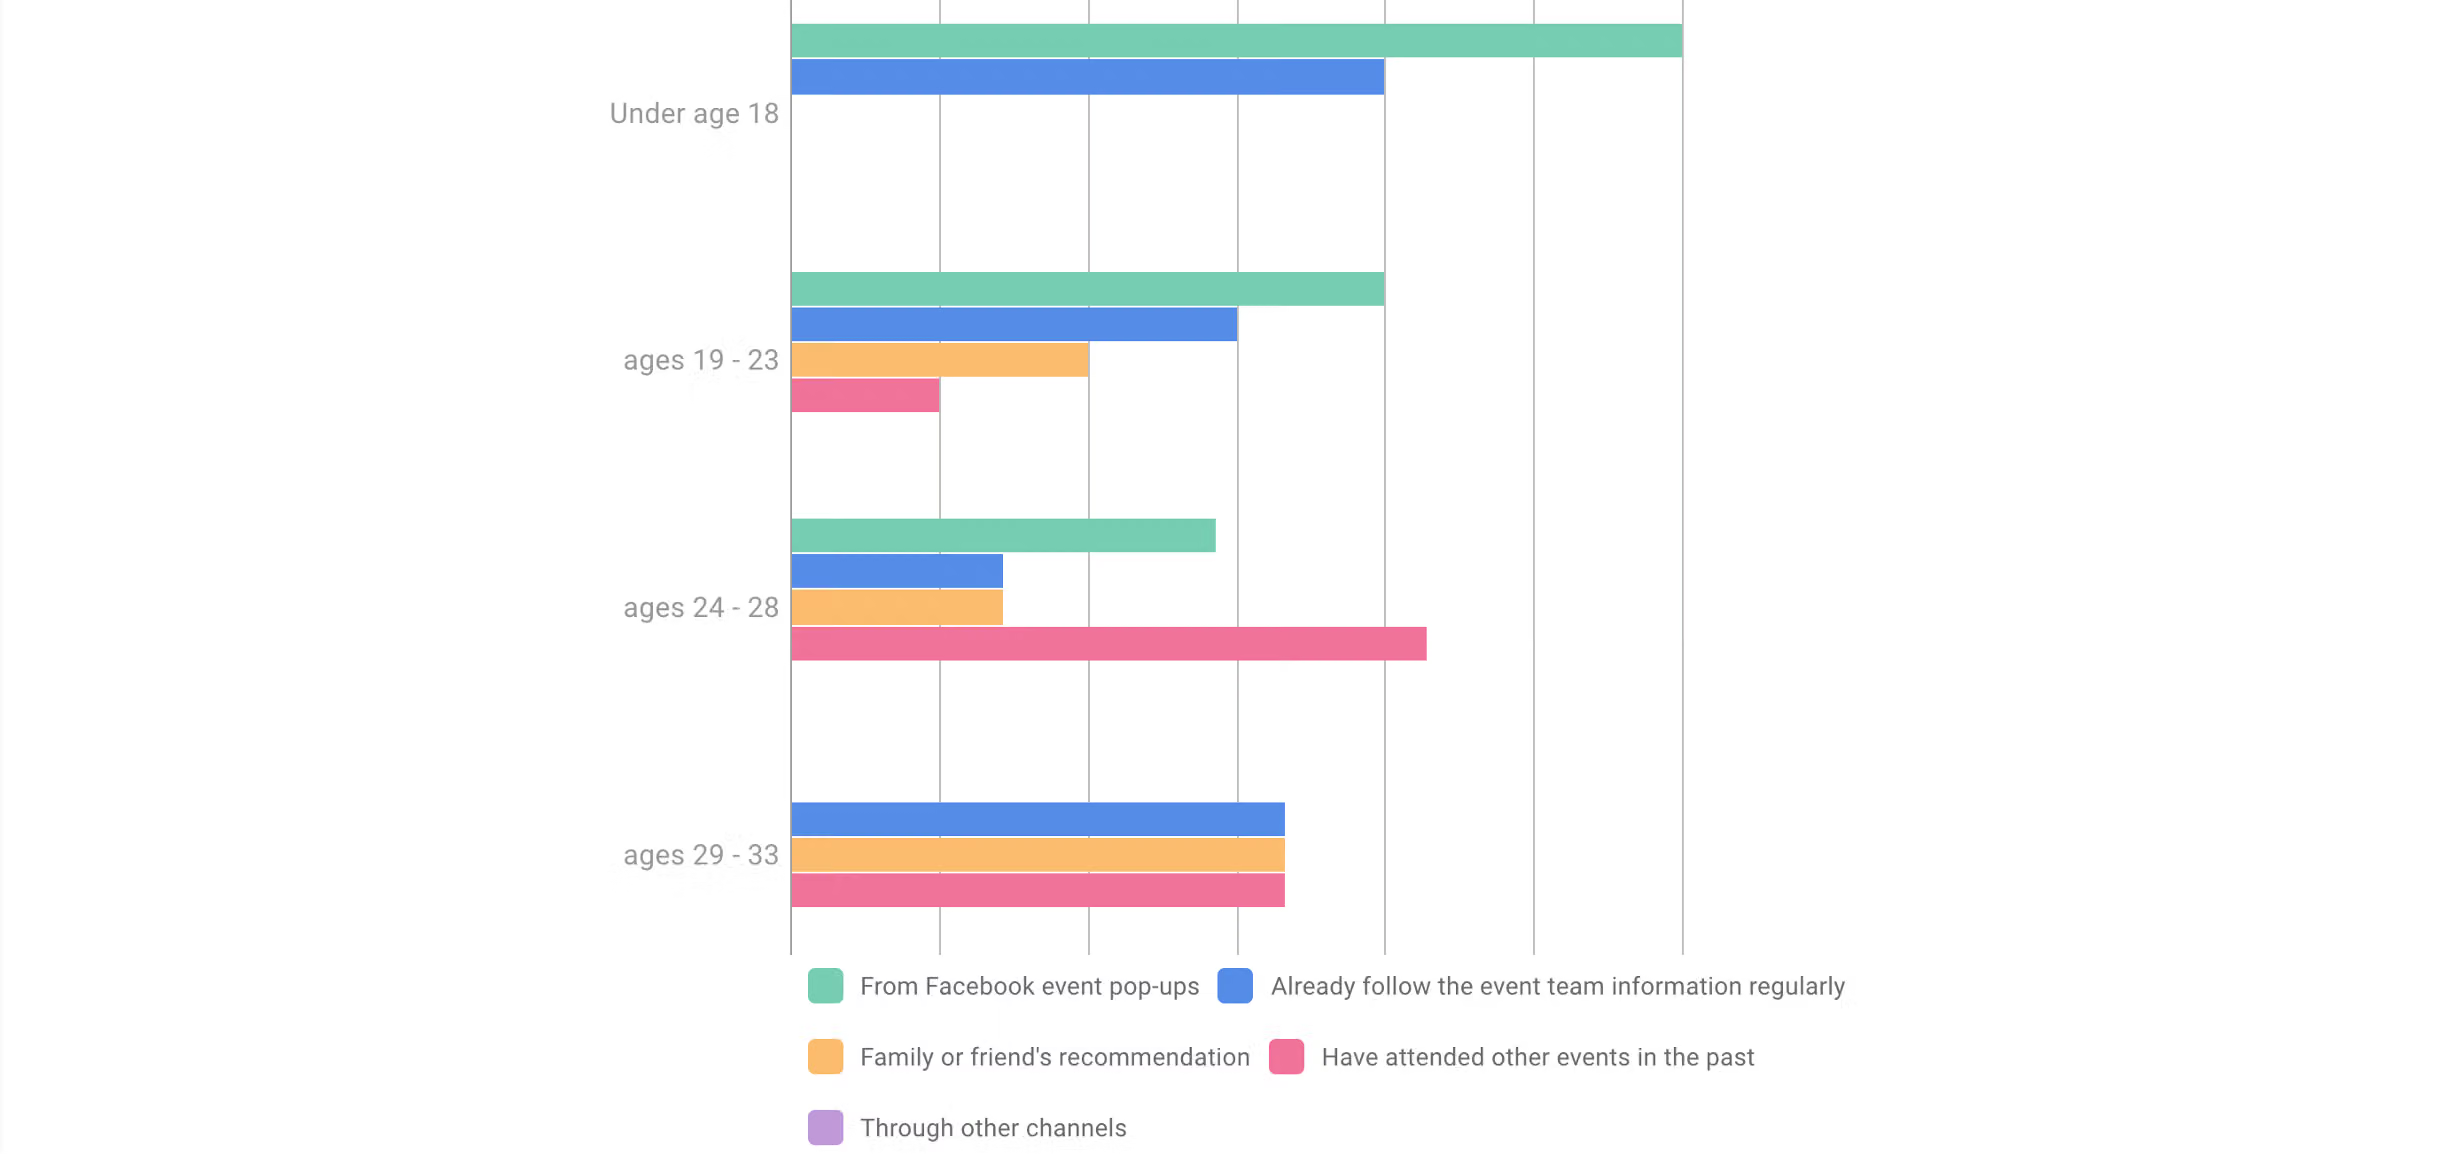
In addition, making good use of “Cross Tabulation” can prevent the voices of specific groups from being ignored. Taking a satisfaction survey as an example, even if the average experience of all customers is “satisfactory”, after cross-analysis, it will be found that: males are mostly “dissatisfied”, while females are mostly “very satisfied”. It’s just because of the difference in satisfaction gap and the proportion of men and women, the opinions of male customers are averaged out!
Quickly experience the powerful presentation and sharing of survey results!
Click here to register for FREE and you can experience more professional and convenient survey result analysis! SurveyCake makes it easy to create surveys and analyze them without hurting your brain!