


Unlock Insight with Real-time Survey Data Analysis

Do you find it troublesome to analyze survey data, having to download each response from the backend system and manually analyze them, which is both time-consuming and labor-intensive?
Don’t worry! We will introduce how SurveyCake can help you solve the above problems from the aspects of “Survey Status” and “Data Analysis”.
Instantly grasp the status of online form responses, precise data analysis without relying on others!
1.Survey Status
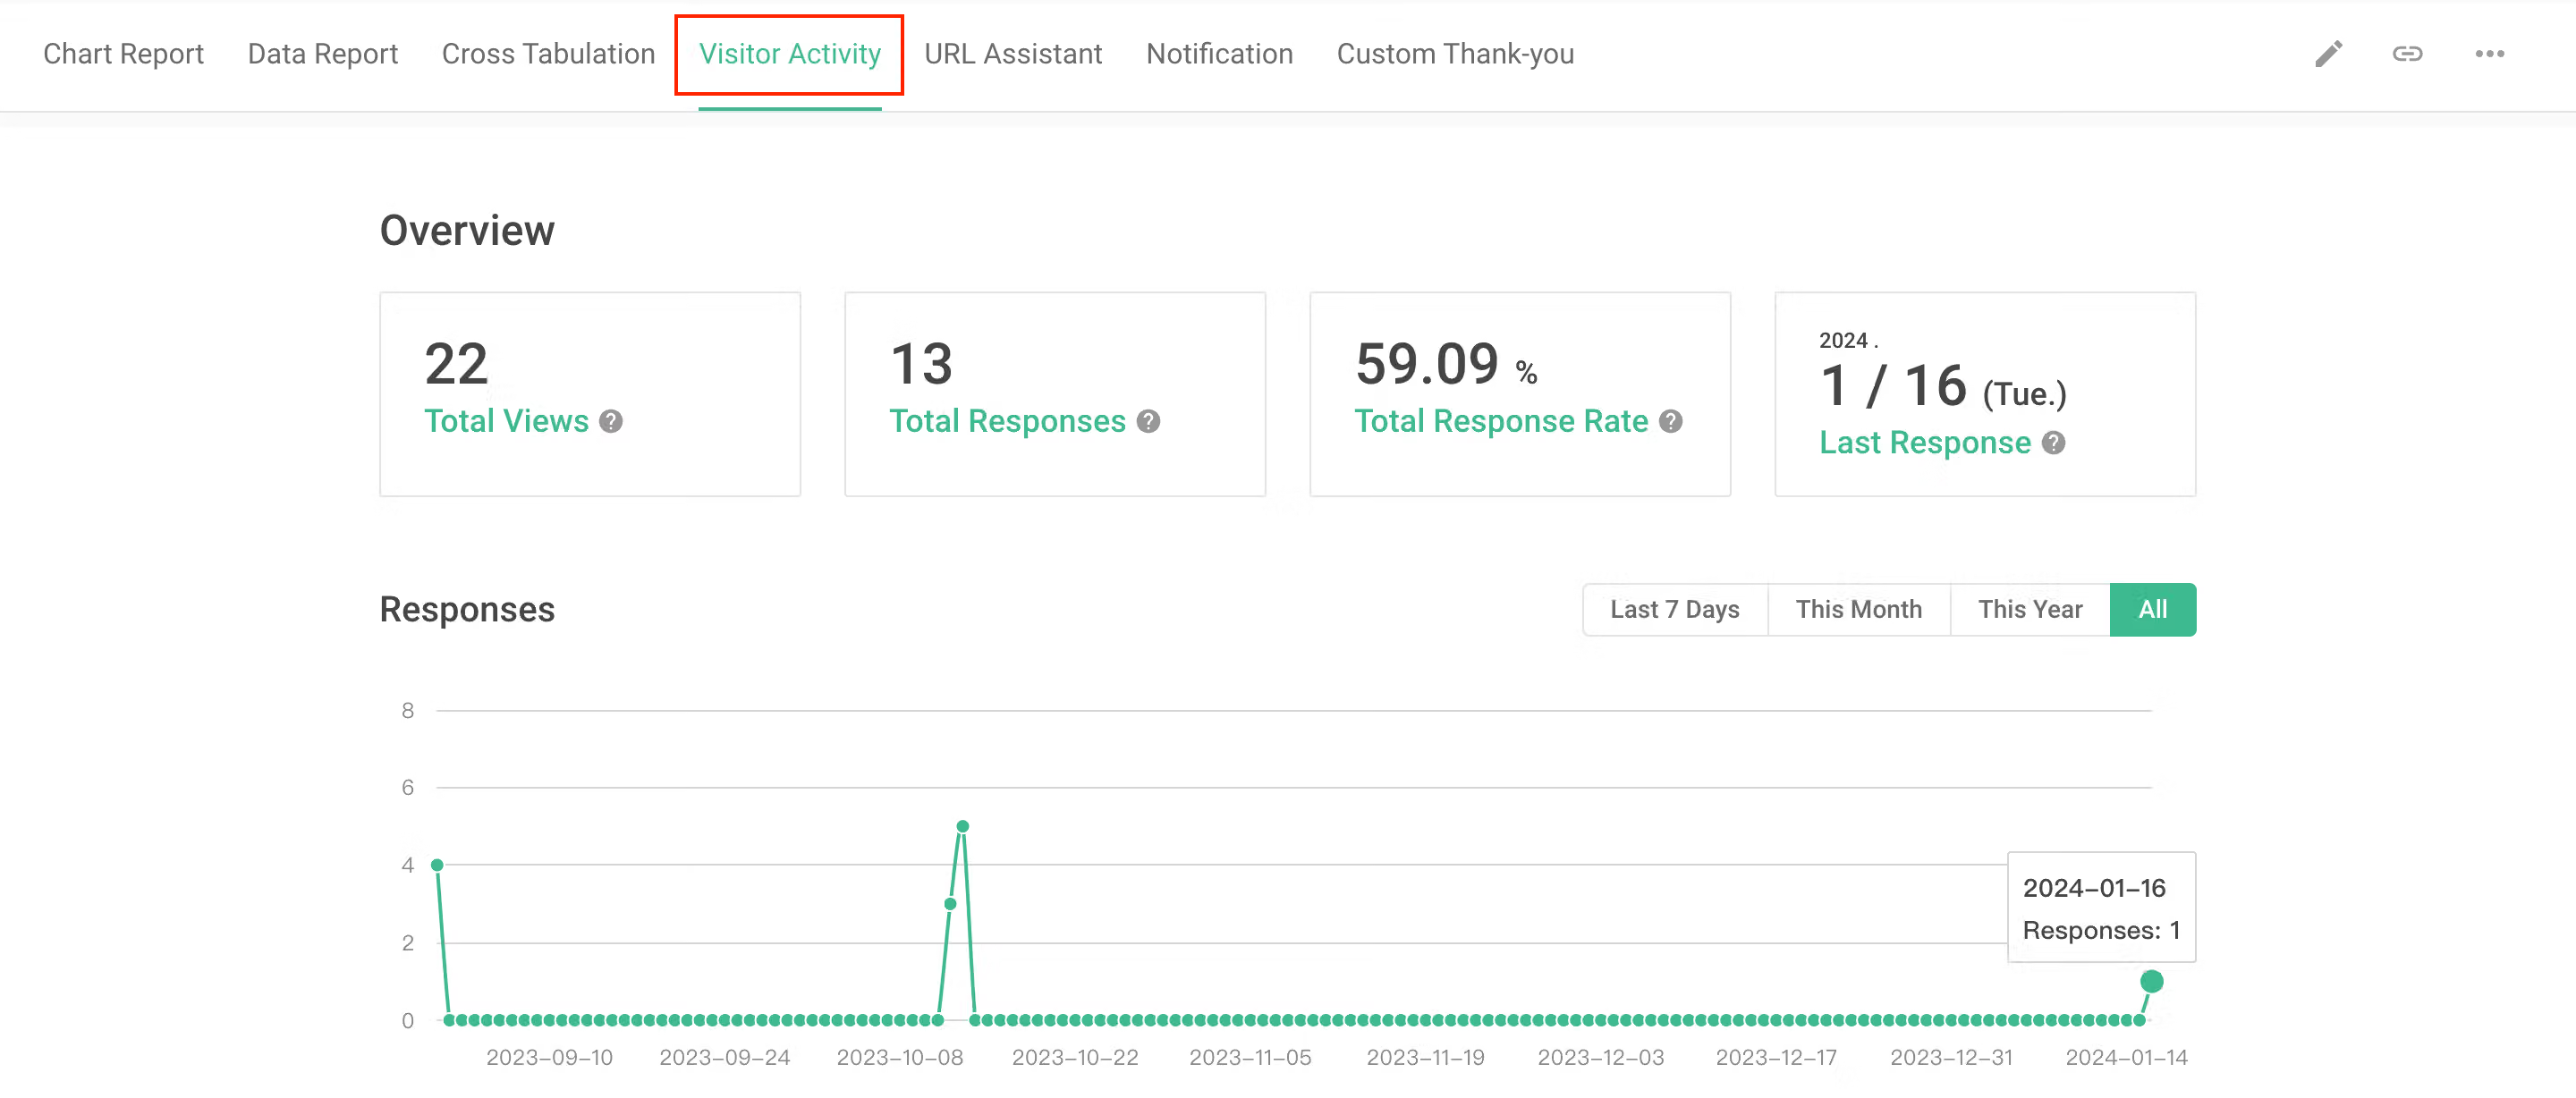
Visitor Activity: Instantly grasp the status of survey responses
In the “Visitor Activity” page, you can obtain real-time data analysis such as “response rate, visit count, response count, device, browser, country, operating system”, etc.
- If the number of visitors is high but the response rate is low, you can consider whether the form content is improperly designed, leading to respondents not completing and submitting the form
- If the number of visitors is low but the response rate is high, you can consider whether the distribution channel of the form is improper or insufficient.
“Visitor Activity” allows you to have a clearer understanding of the profile of survey respondents.
2.Data Analysis
Previously, when analyzing survey data, it was necessary to download all responses from the backend system and manually analyze them. However, when there is a large amount of data, it is not only time-consuming and labor-intensive but also prone to errors!
Now, SurveyCake allows you to directly view “Chart Report” in the backend and even perform “Cross Tabulations” of options within different questions. This reduces unnecessary operational steps during analysis and makes data presentation quicker!
Statistical Charts: Easily interpret a large amount of data in a second
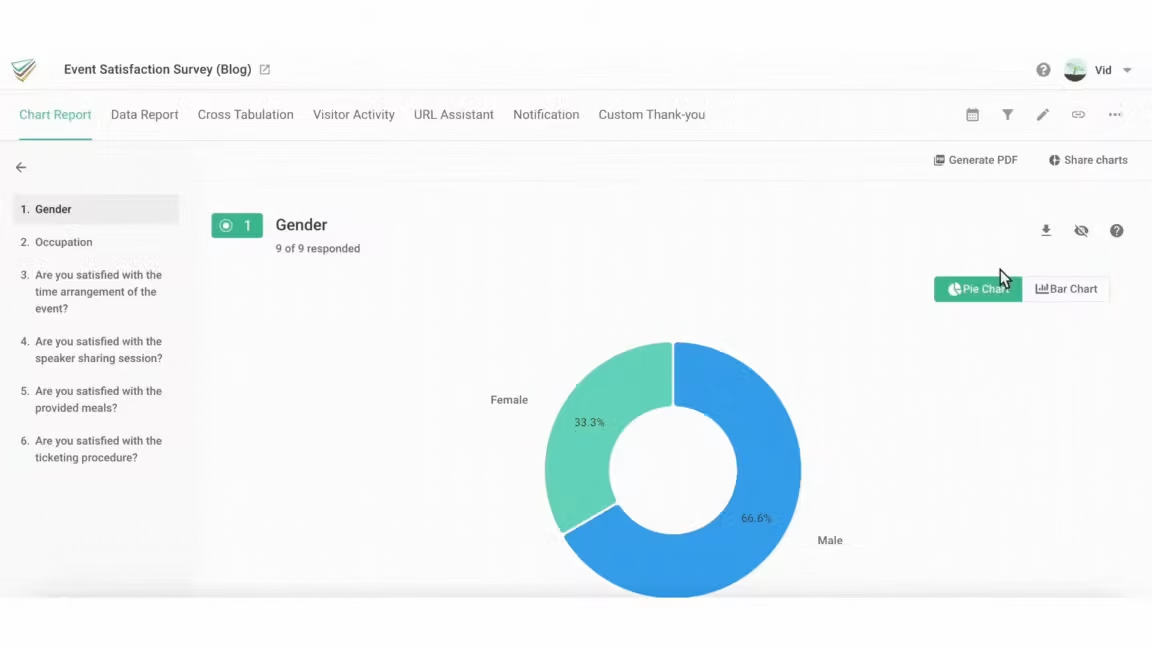
The SurveyCake backend system provides real-time statistical chart analysis, including “word clouds, bar charts, pie charts, weighted presentations”. You don’t need to export data separately to compile charts, saving you time and effort!
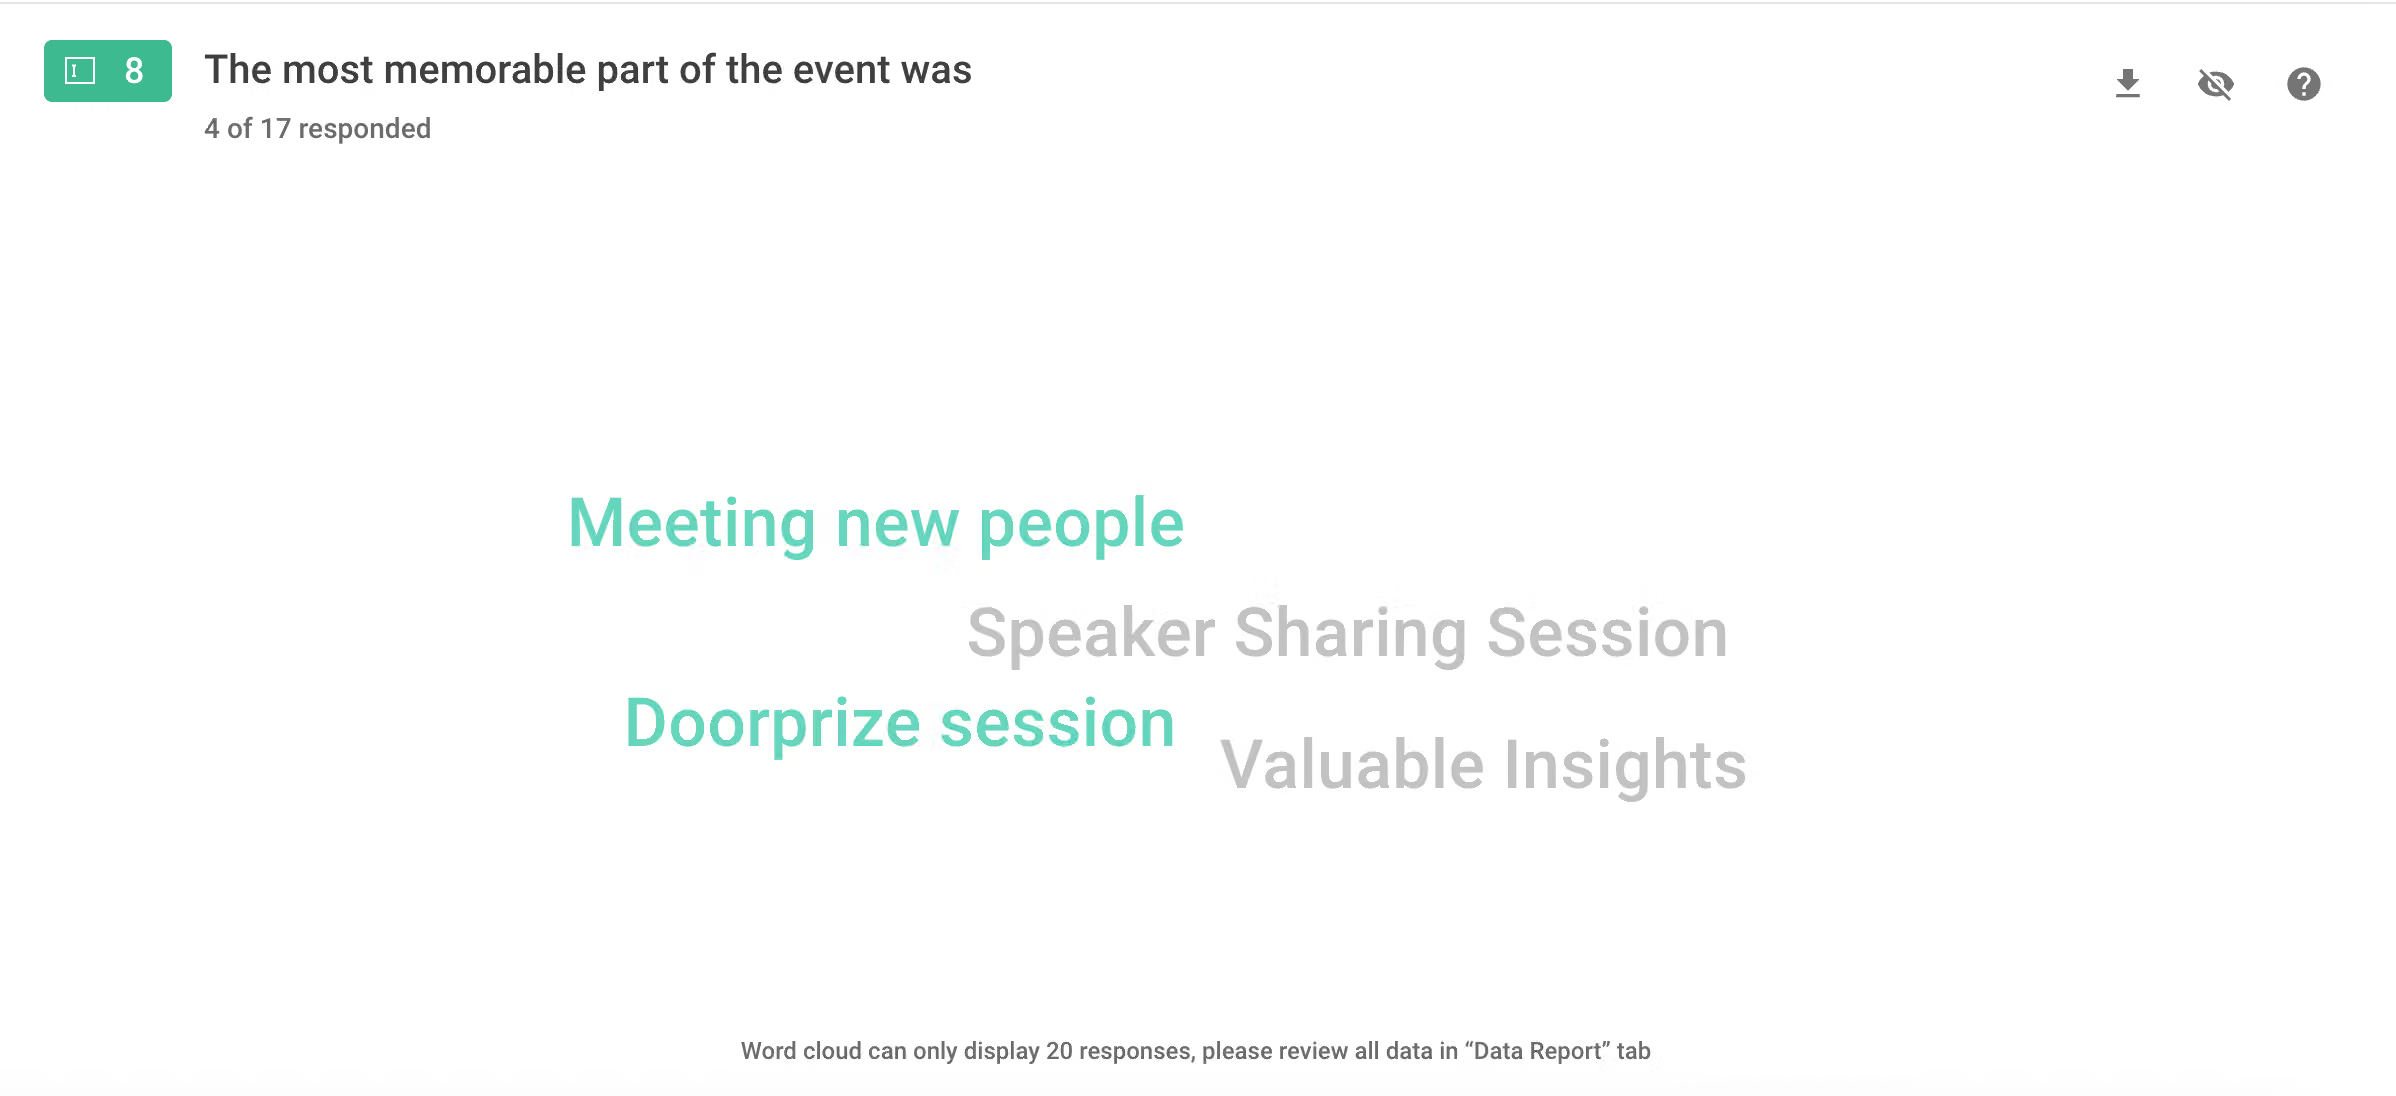
- For “open-ended questions”, the data will be displayed in the form of “word clouds”.
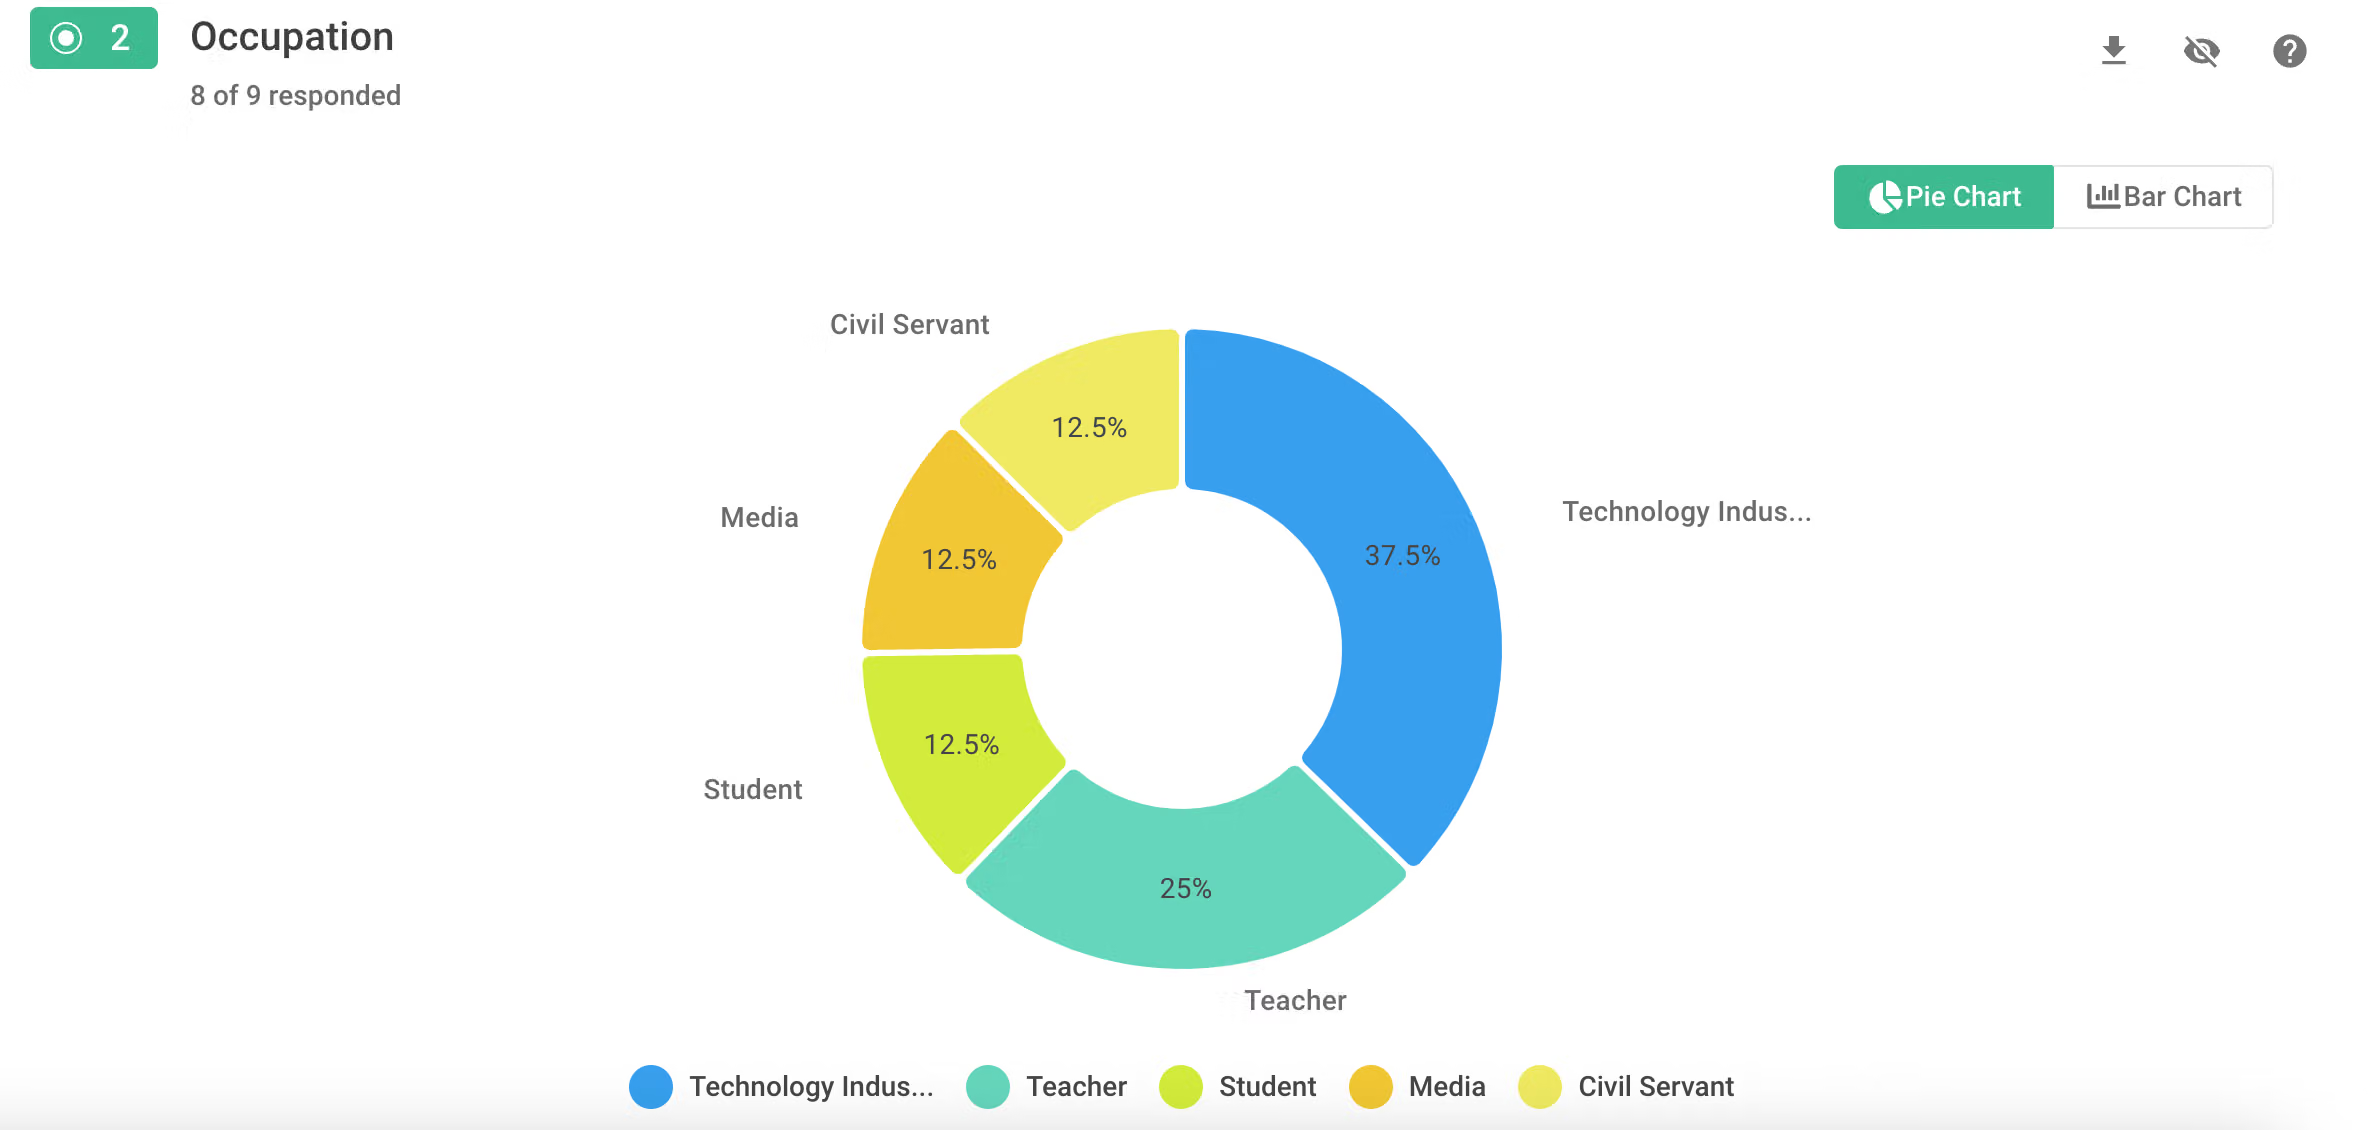
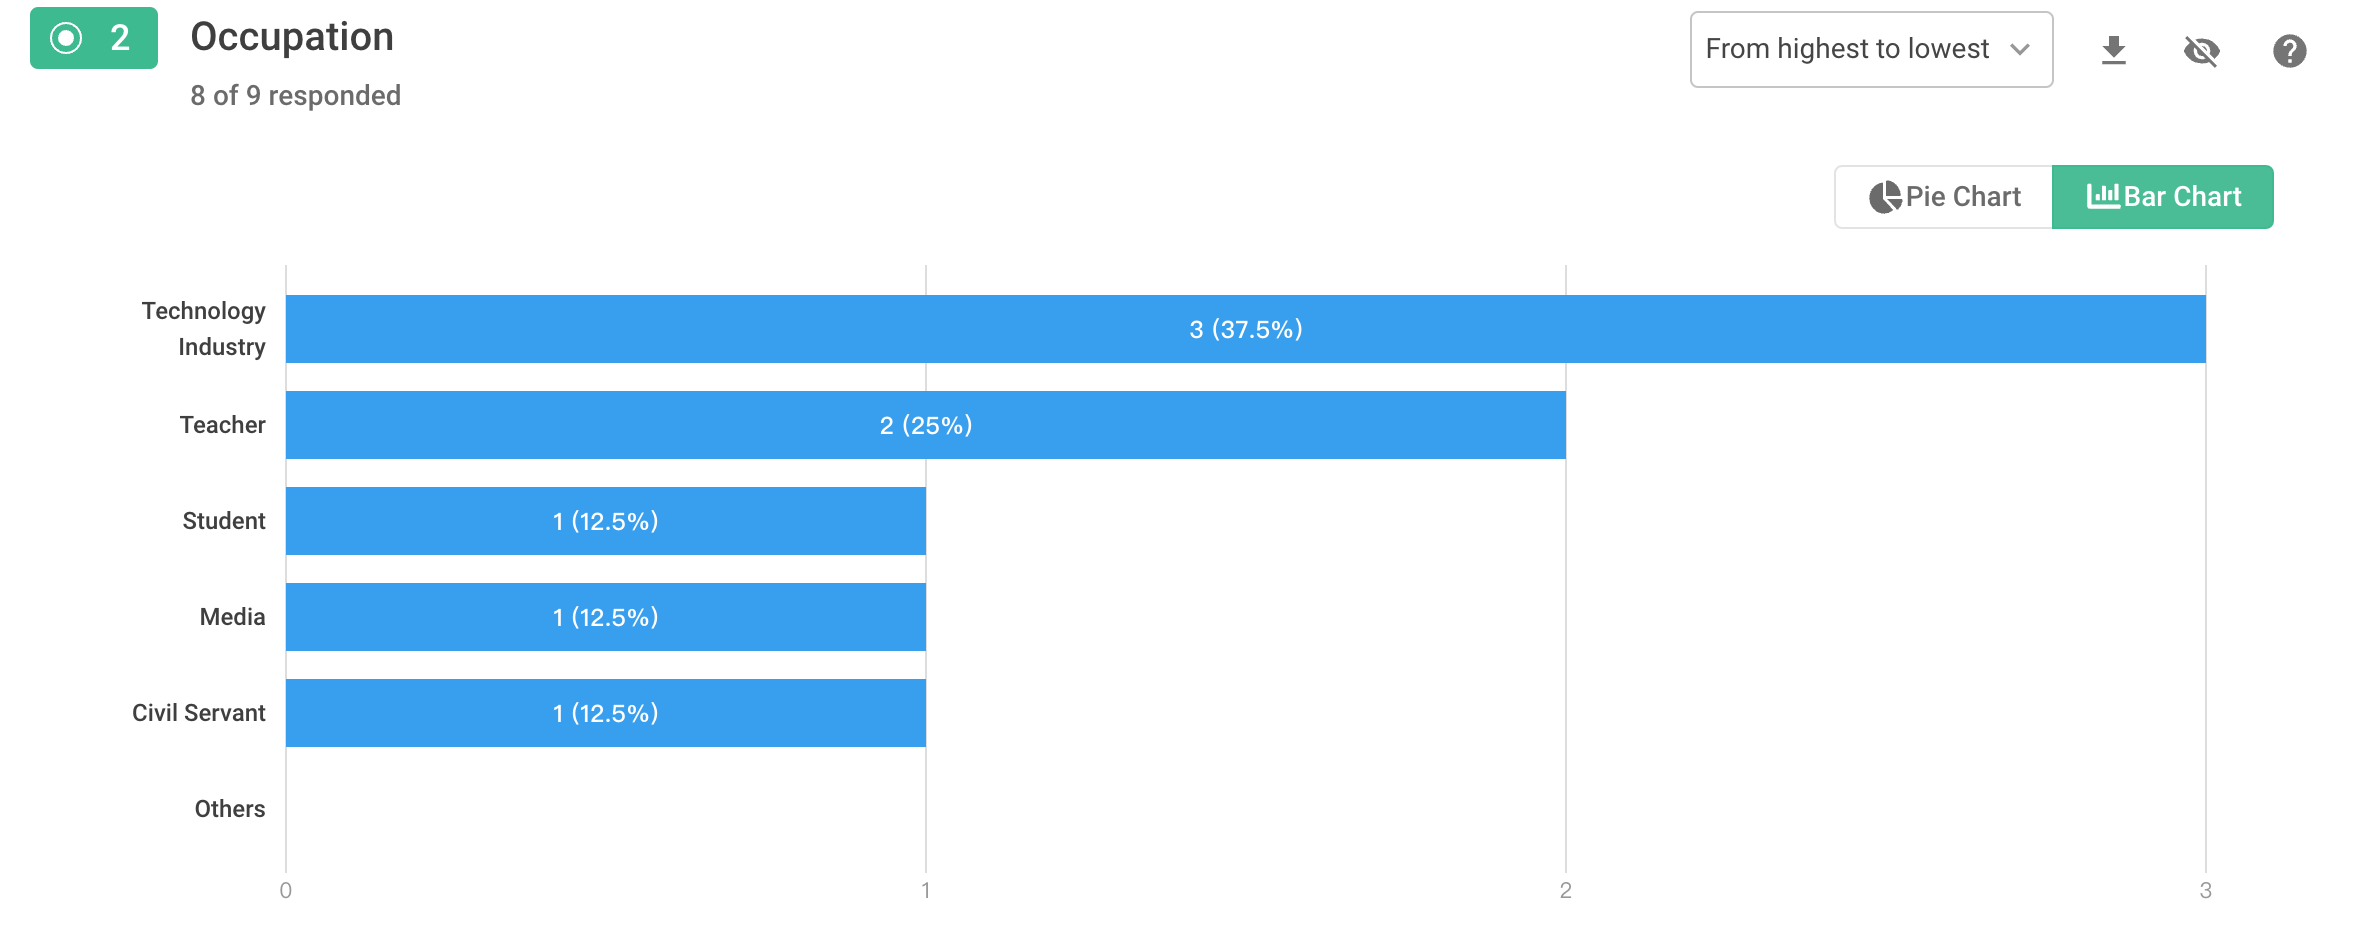
- For “Multiple Choice” and “Checkboxes” questions, the data will be displayed as “Bar Chart” and “Pie Chart”.
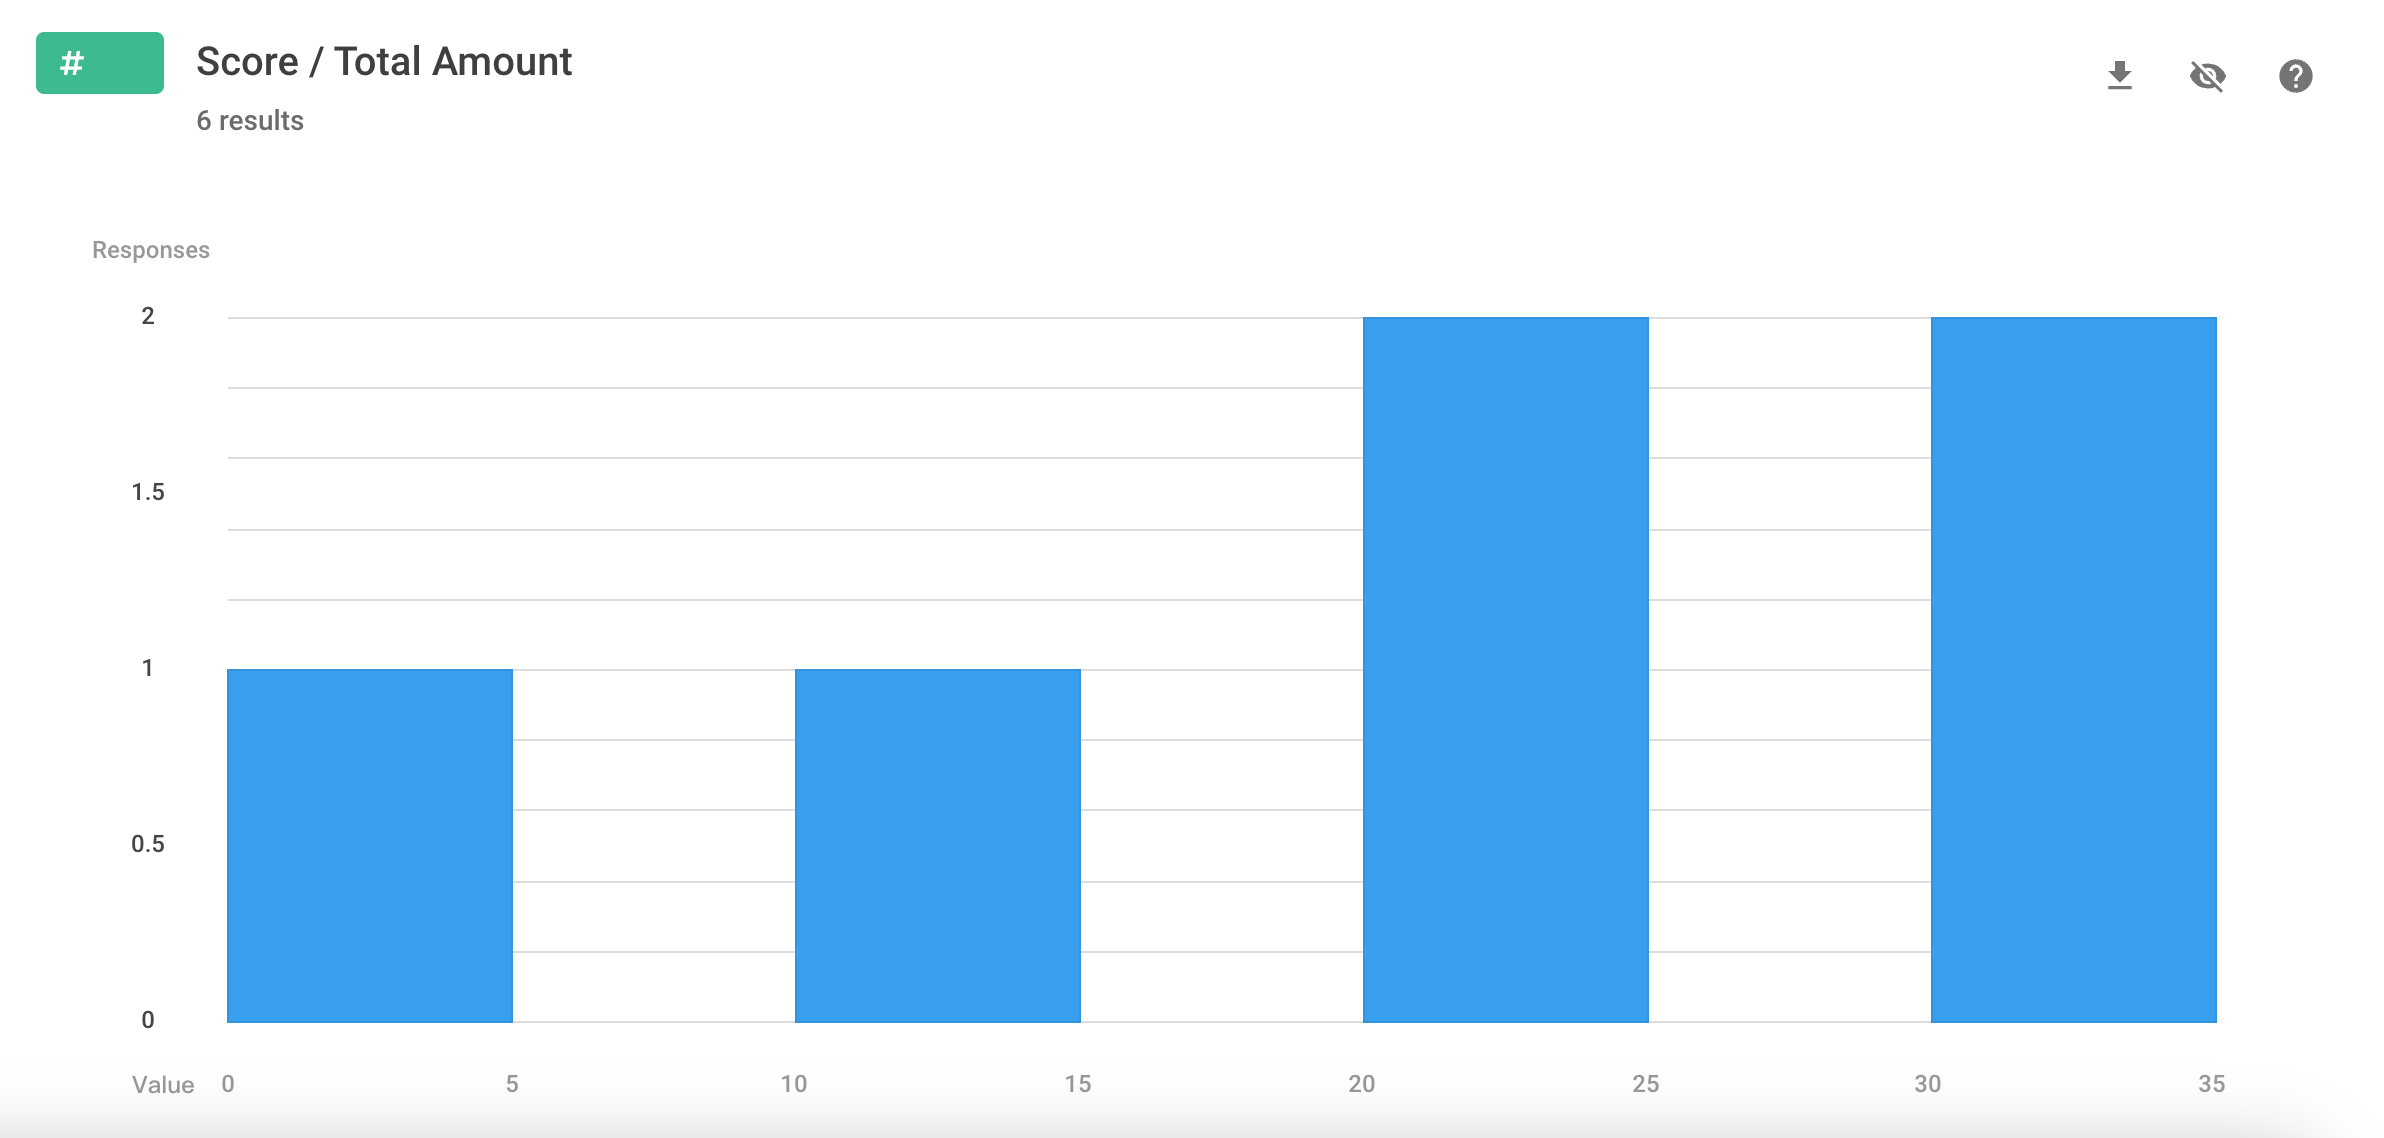
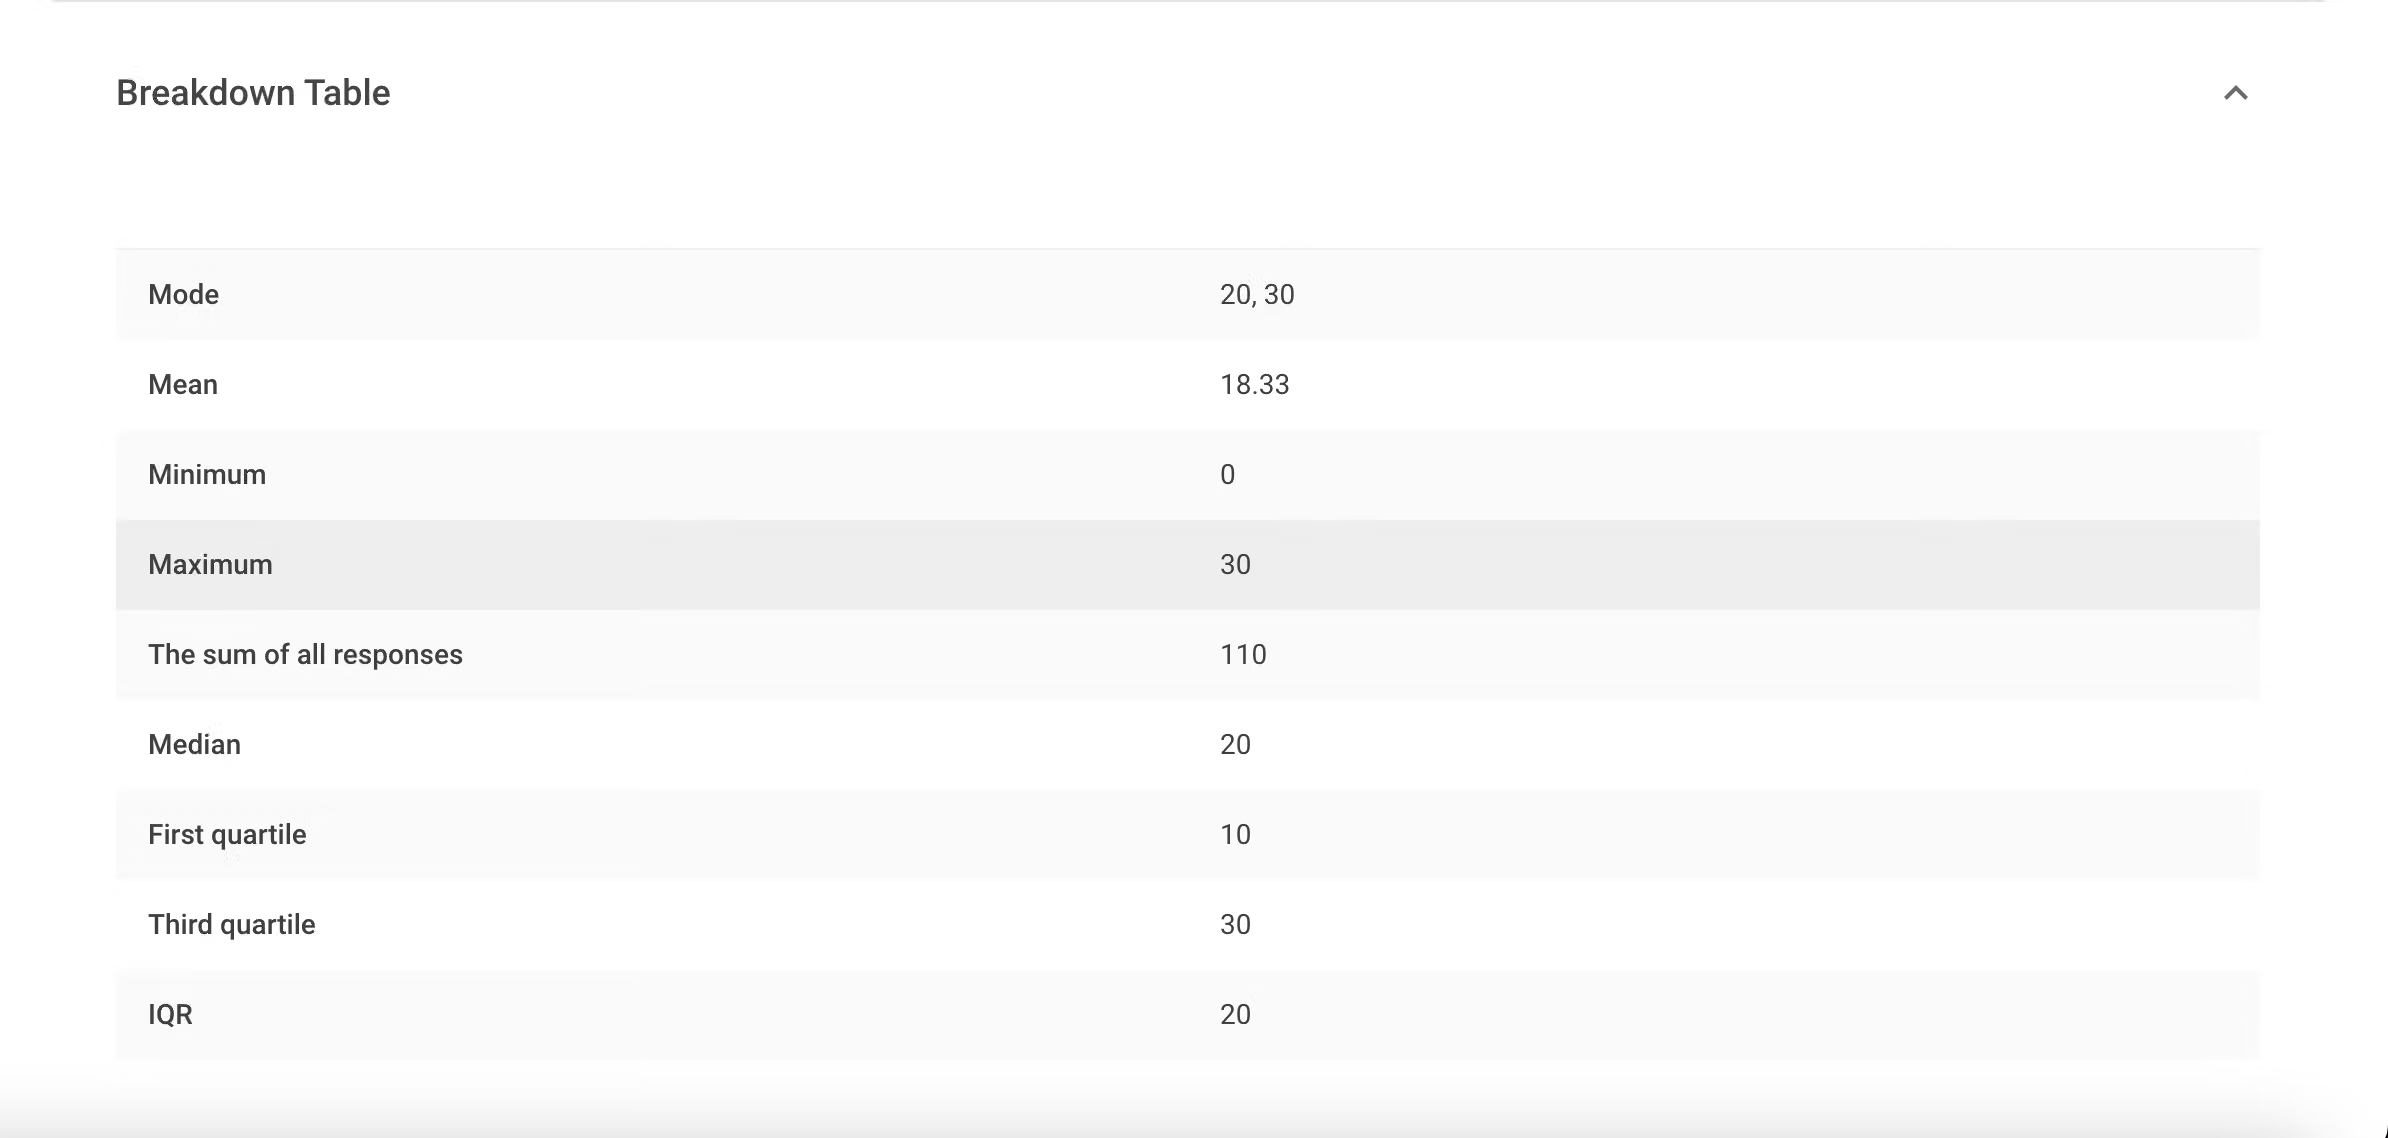
- For “Number” and “Slider” questions, the data will be displayed as a “Bar Chart” , accompanied by a “Breakdown Table”, automatically presenting values such as mode, mean, median, standard deviation, etc.
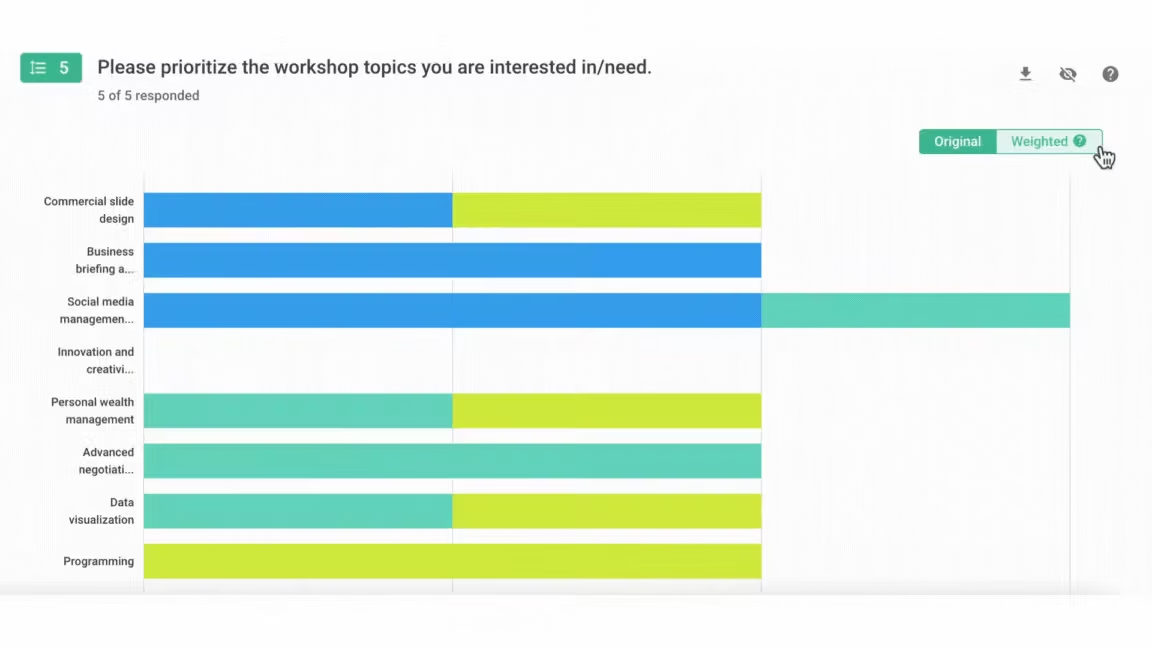
- For “Ranking” questions , the “original values, weighted values” will be displayed, with the top-ranked options having higher weights. The system will also automatically plot the distribution of the top three rankings separately.
The data collected by SurveyCake backend supports export in “PDF, Excel, SPSS” formats, so you can export the statistical charts introduced above as PDF files for additional use!
Filter: Precisely analyze specific condition samples
When analyzing form responses, you not only want to analyze single options but also cross tabulations between different options. For example, if we want to know the number of people who rated “very dissatisfied” in “time arrangement” but “very satisfied” in “sharing session”, along with their detailed response status, we can achieve this through filtering.
Click HERE for more information about Filter!
Cross Tabulation: Easily compare the relationship between two variables
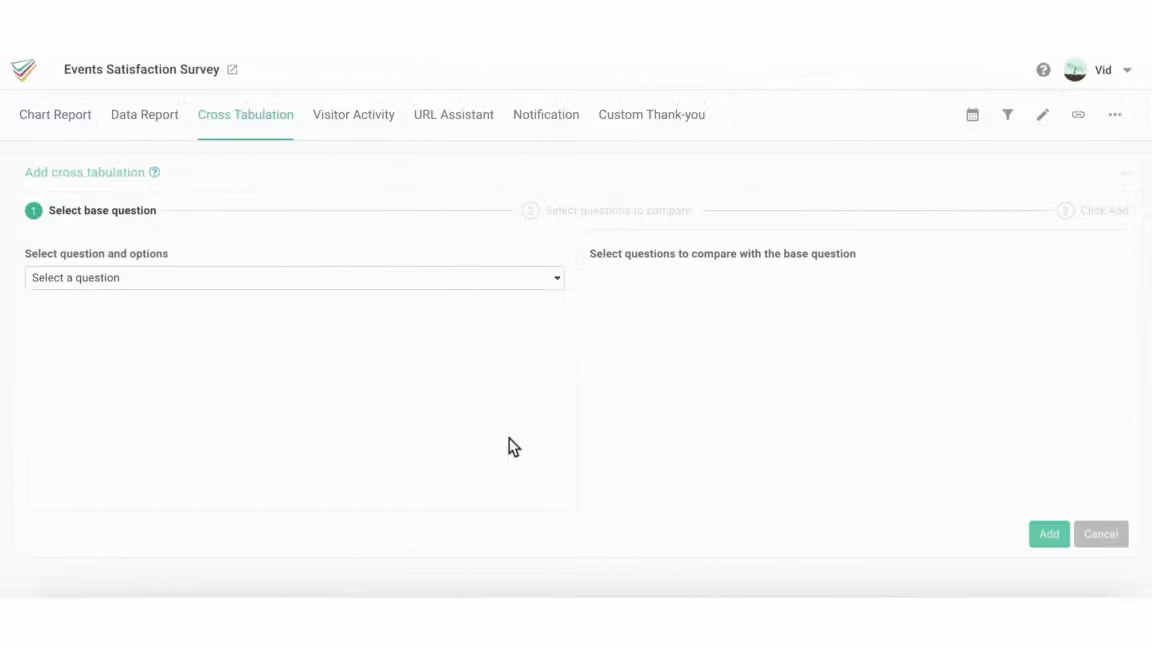
You can use the “Cross Tabulation” feature to compare the relationship between two variables and generate cross-comparison tables. Taking the satisfaction survey as an example, you can select “age” and “brand information source channel” in the questionnaire as variables for analysis. This way, you can easily see the sources of product information for different age groups!
What’s even better is that cross-tabulation can help you avoid averaging bias, ensuring that the voices of specific groups are not ignored. For example, in a satisfaction survey, even if the average experience of all customers is “satisfied”, after cross-analysis, it may be found that males are mostly “dissatisfied” while females are mostly “very satisfied”. It’s just because of the difference in satisfaction gap and the proportion of males and females, which leads to the opinions of male customers being averaged out!
Quickly use SurveyCake to create your survey!
SurveyCake not only allows you to create professionally designed forms but also provides powerful support for tracking and analyzing forms in the future, saving you more time and achieving better results!