First, select the survey you wish to filter, then locate the funnel-shaped icon on the top right corner.
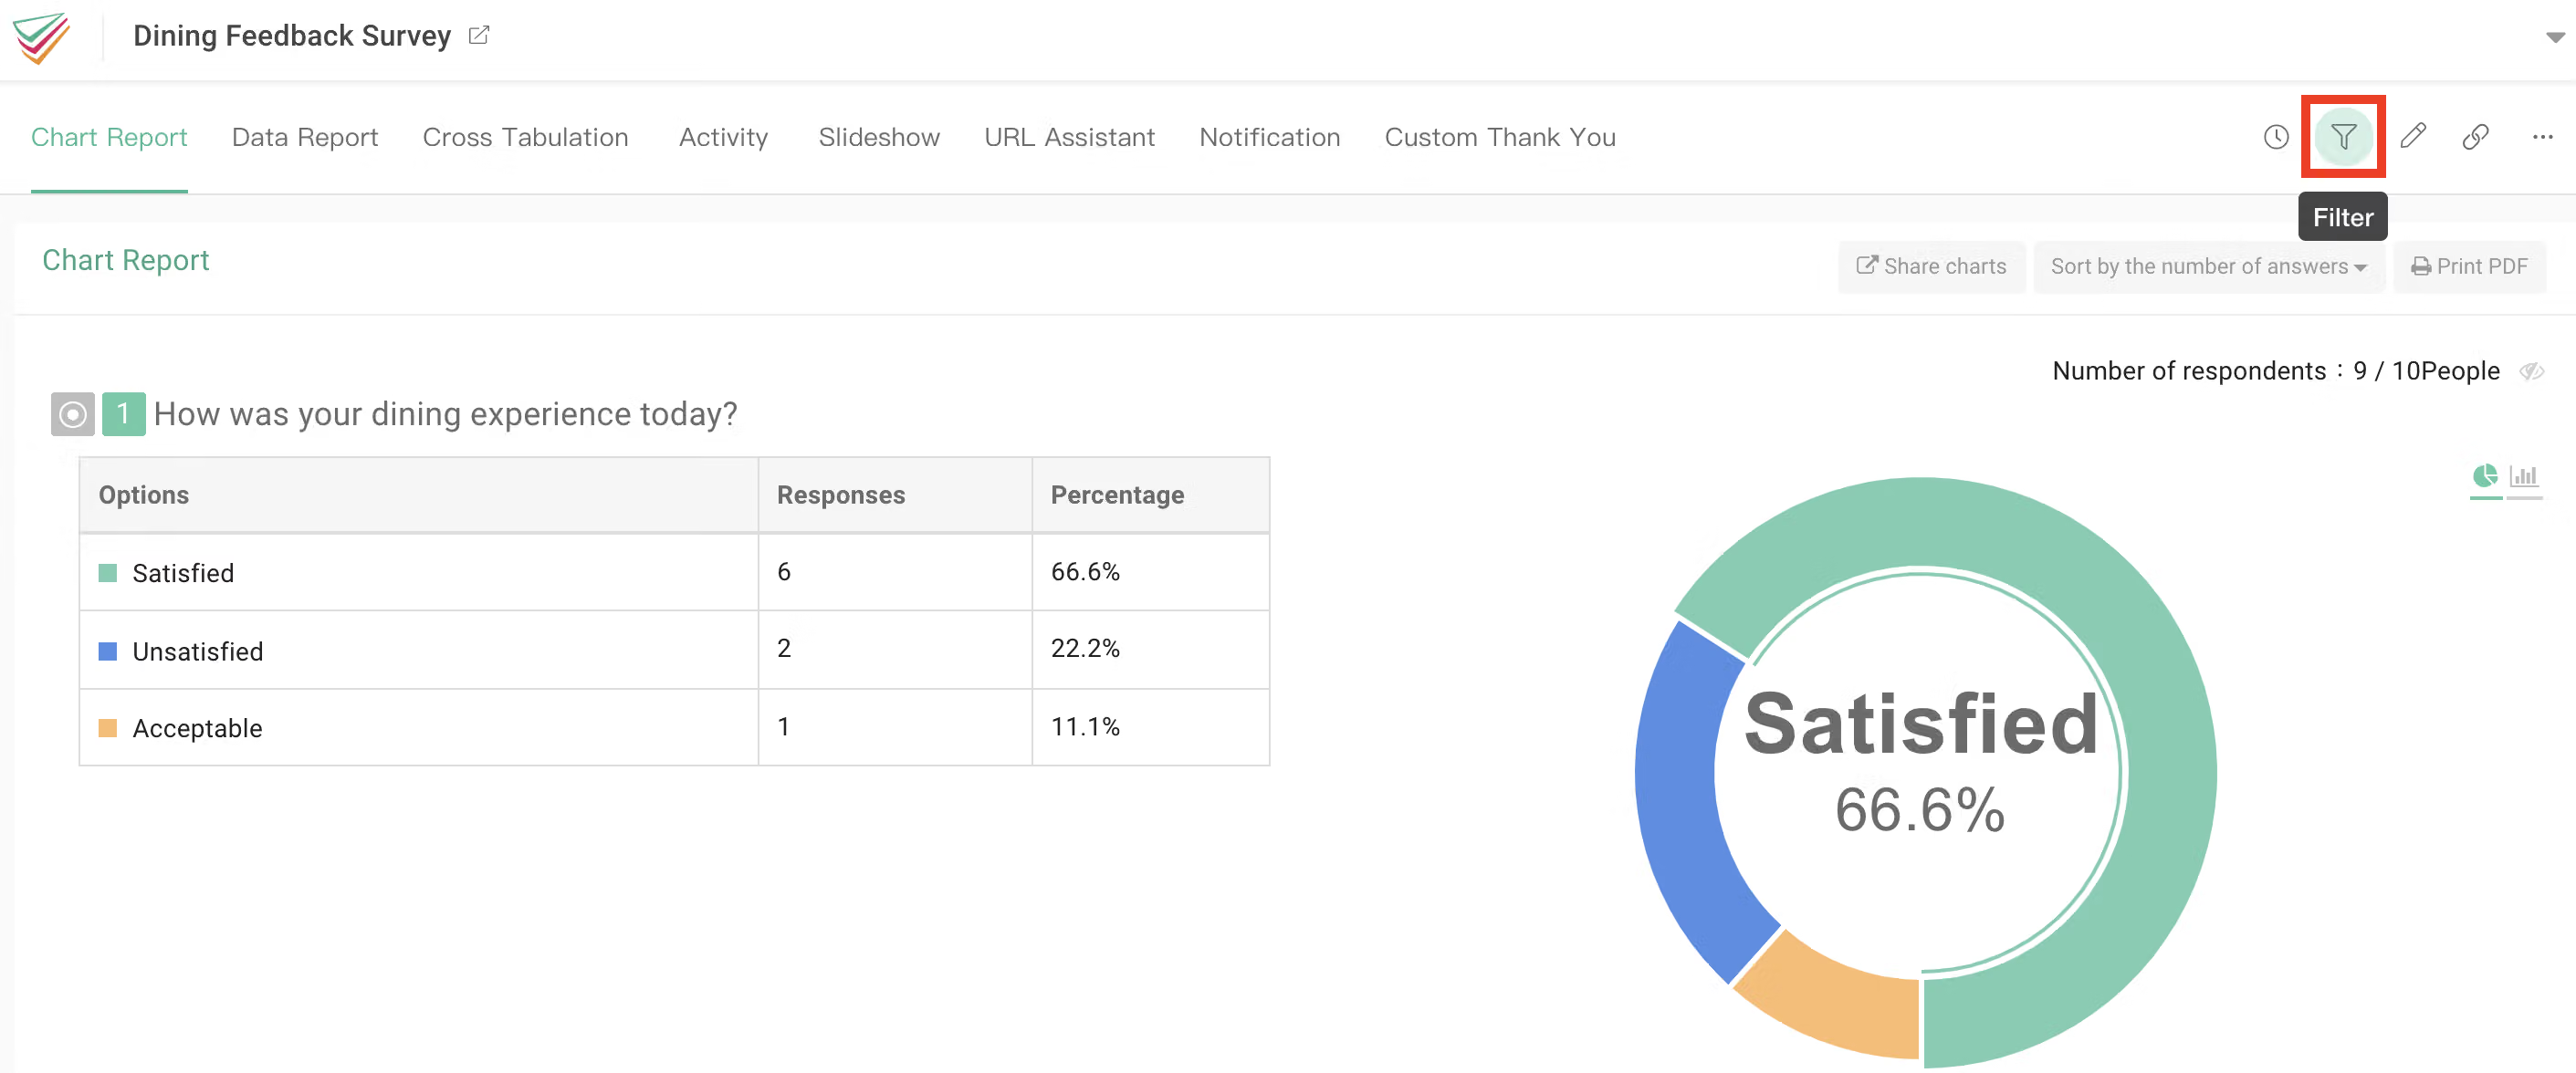
Click the funnel icon and the Filter setting will appear.
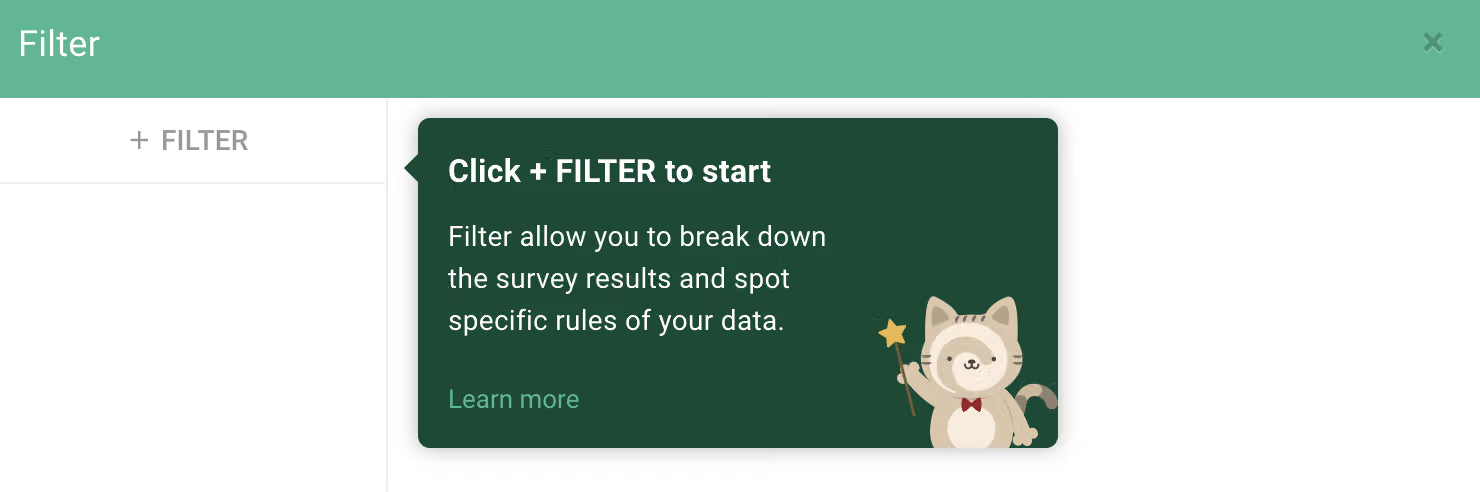
Add a filter by clicking +FILTER. Multiple filters may be set for a single survey! Once a new filter has been added, it's time to add the filter criteria.
Select the questions to be filtered, and then choose options or type keywords as criteria.
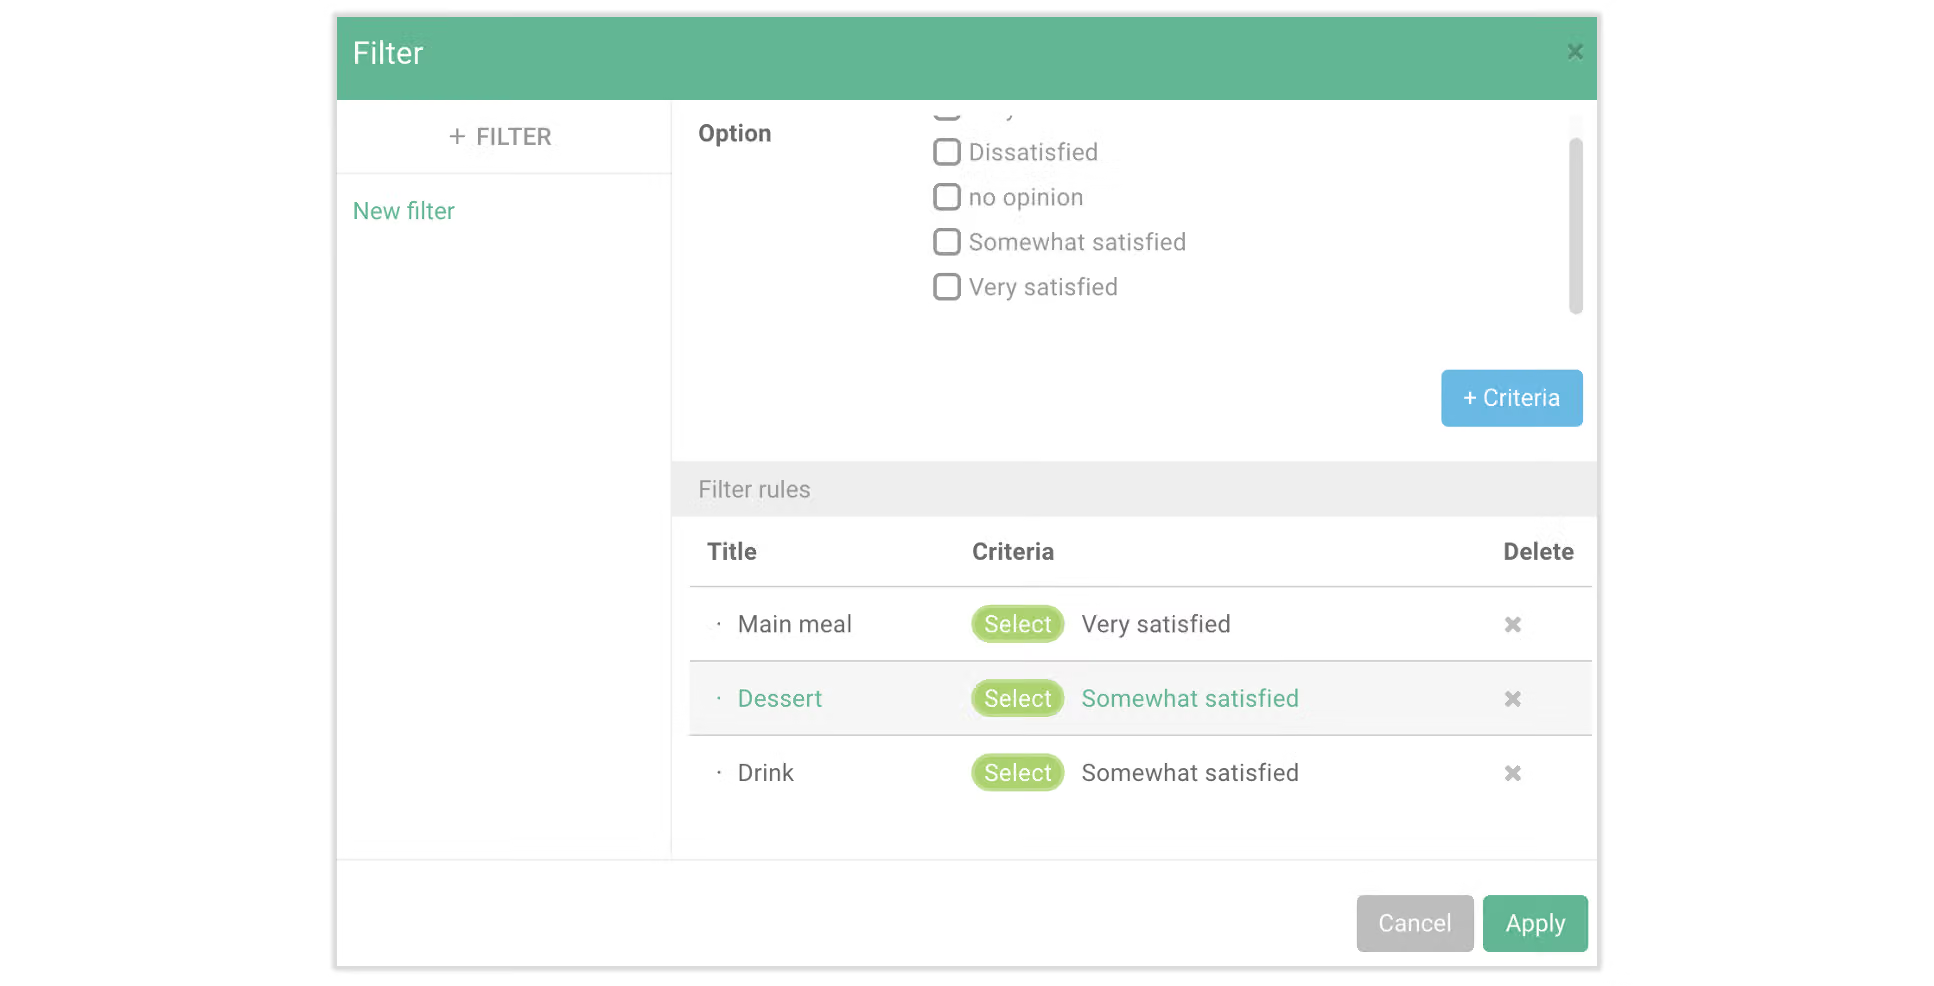
Using a satisfaction survey as an example below: Suppose we want to filter people who are "Very satisfied" with "Main meal."
Select question "Main meal" and set the filter criteria to samples with "Very satisfied" as the answer. Once conditions are set, click +Criteria.
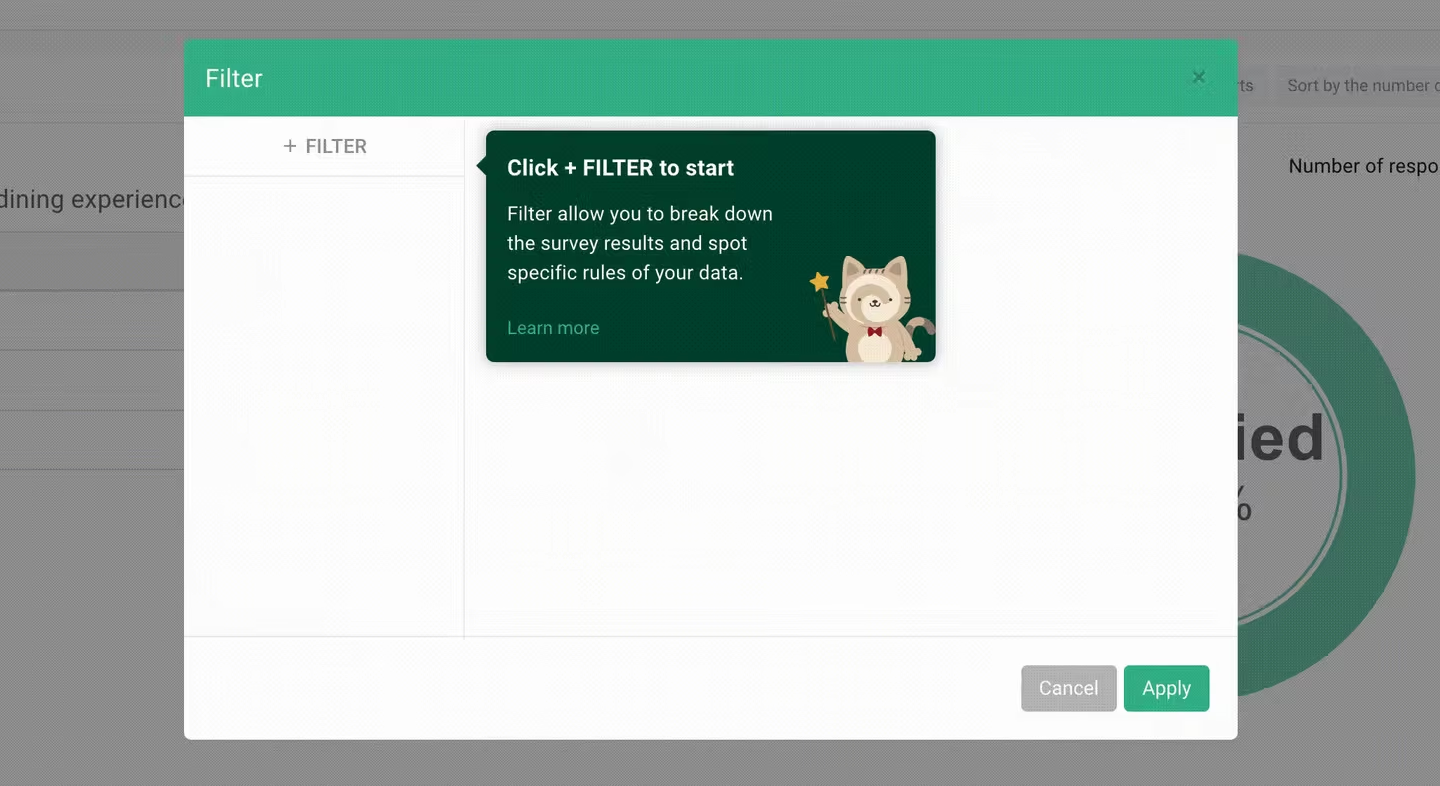
Press Apply, and the Chart Report and Data Report tabs will show the data matching your filter setting. All other data will be hidden. (Don't worry, hidden data is not deleted.)
Similarly, multiple filter criteria can be added to the same filter, and the system will filter out samples that meet these criteria at the same time!
In addition, some question types must be filtered by entering text or numbers.
For example, for this short response question: "Was there a difference compared to your previous dining experience?" It is necessary to set filters by which words in the respondent's answers are Contain or Match. If there are multiple keywords, separate them with commas.
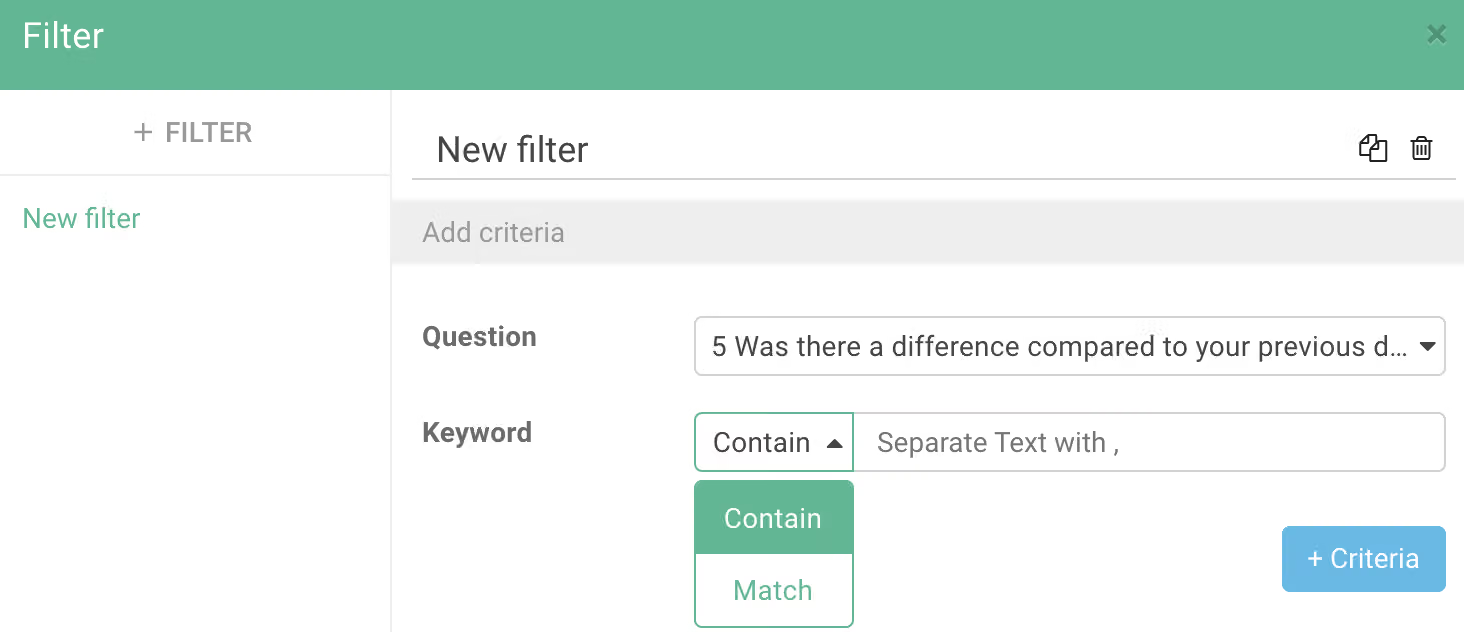
For example, if the filter criteria include "unsavory", then answers containing "extra unsavory," "super unsavory," and "extremely unsavory" will all be filtered.
For example, if the filter criteria include "unsavory," then only answers matching "unsavory" will be filtered. "Extra unsavory," "super unsavory," and "extremely unsavory" will not be filtered.
Continuing the example, if you set the filter criteria in this question to include "terrible" or "gross" you must separate the two keywords with a comma and add the filter criteria.
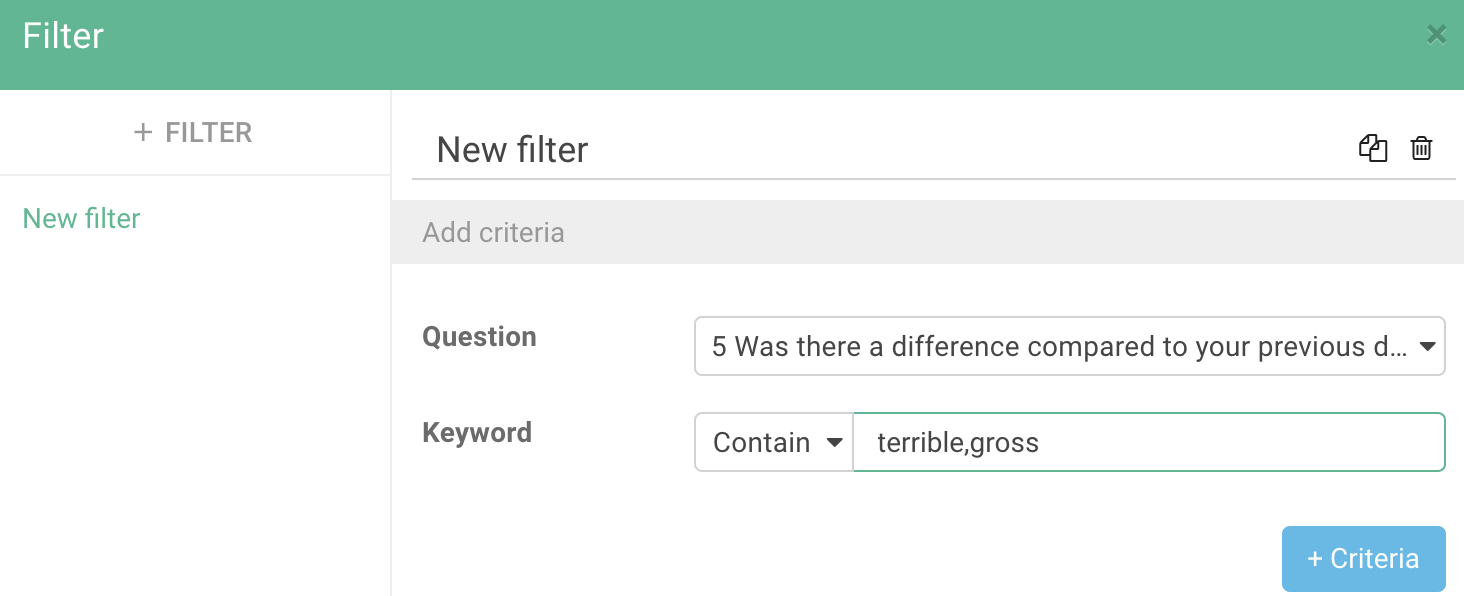
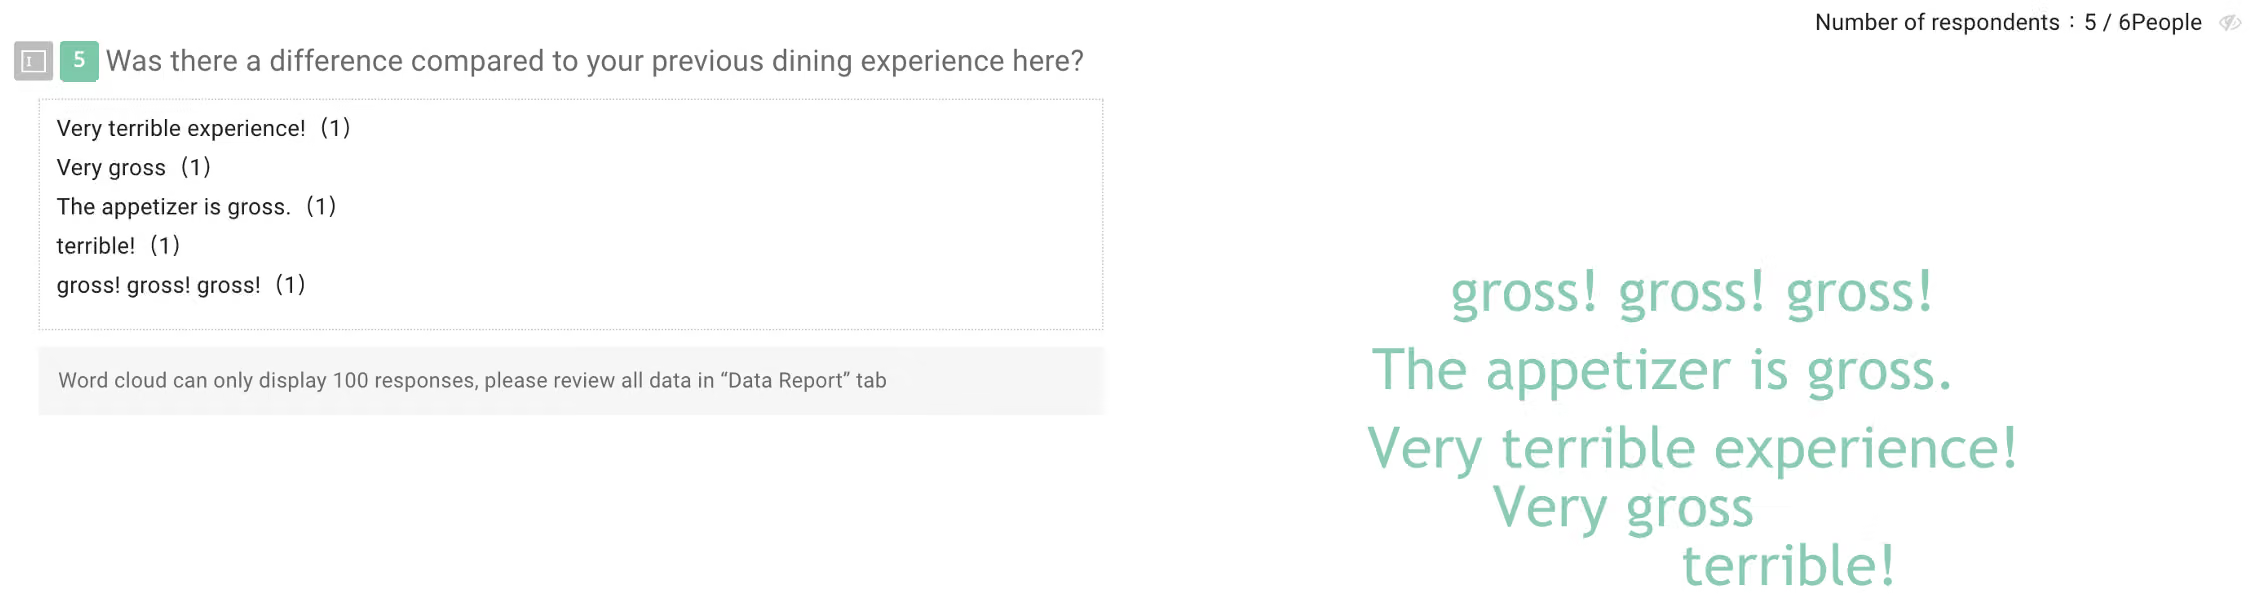
Once the filter has been applied, then the charts will filter all answers with "terrible" and "gross"!
Finally, the filter settings are saved automatically. Even if the Filter is not applied after being set, the next time you open Filter settings you will still see these criteria you have set previously!
FAQ
After entering the survey results page, if the date filter icon is highlighted in green, it means that a previously set date filter has not been cleared. To clear the filter, click the icon and then click "Clear Filter".
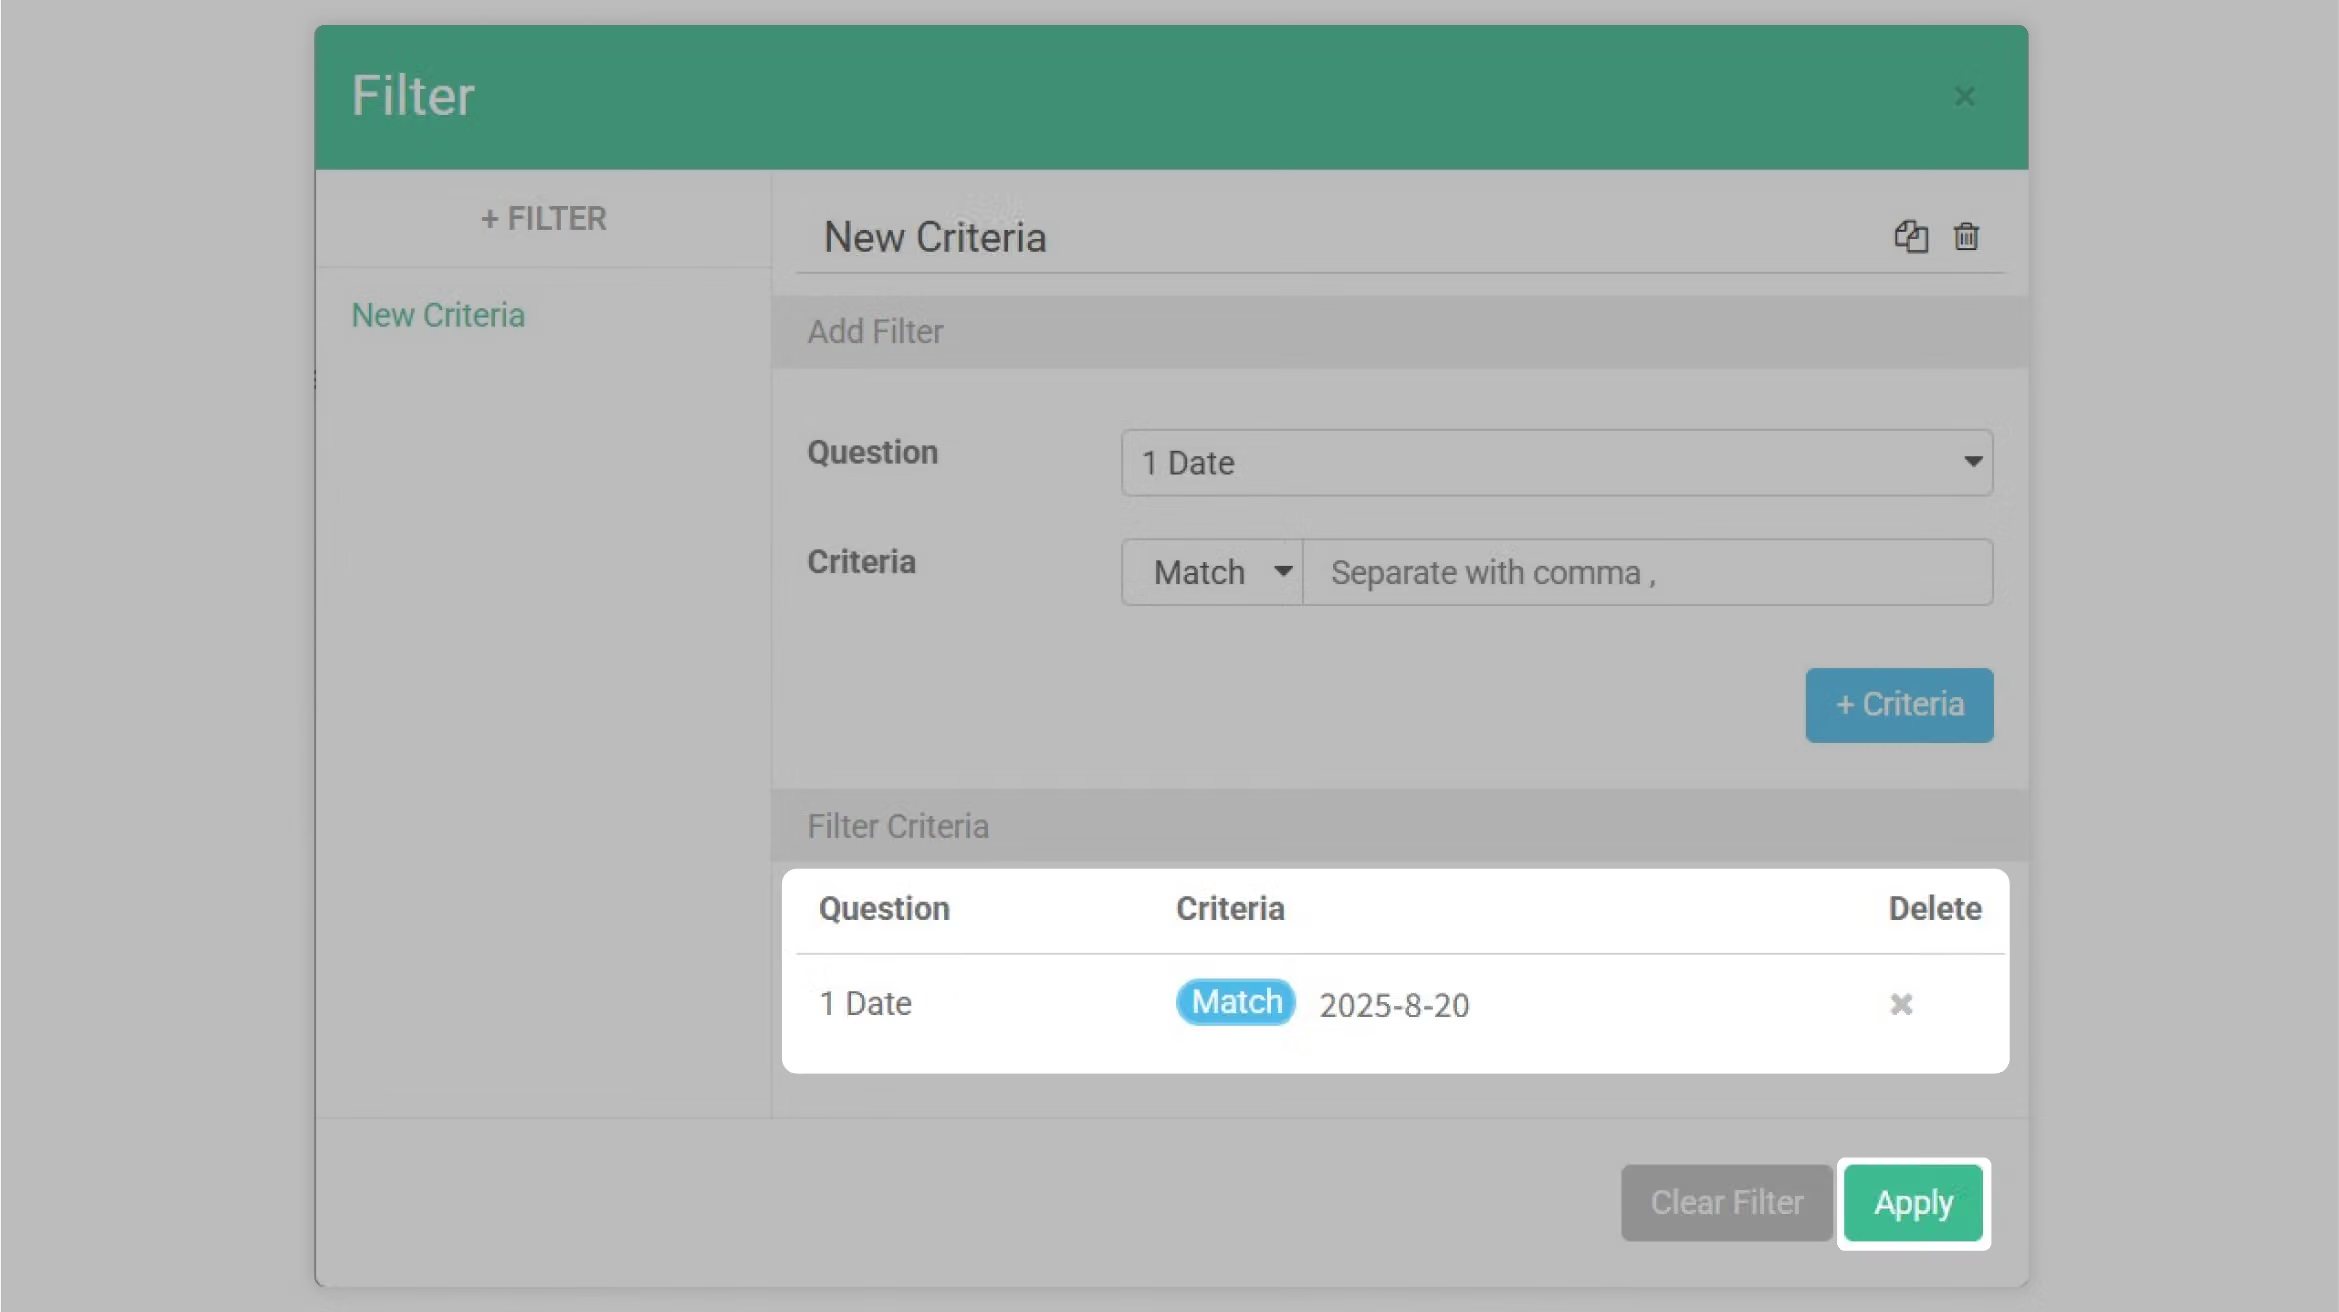
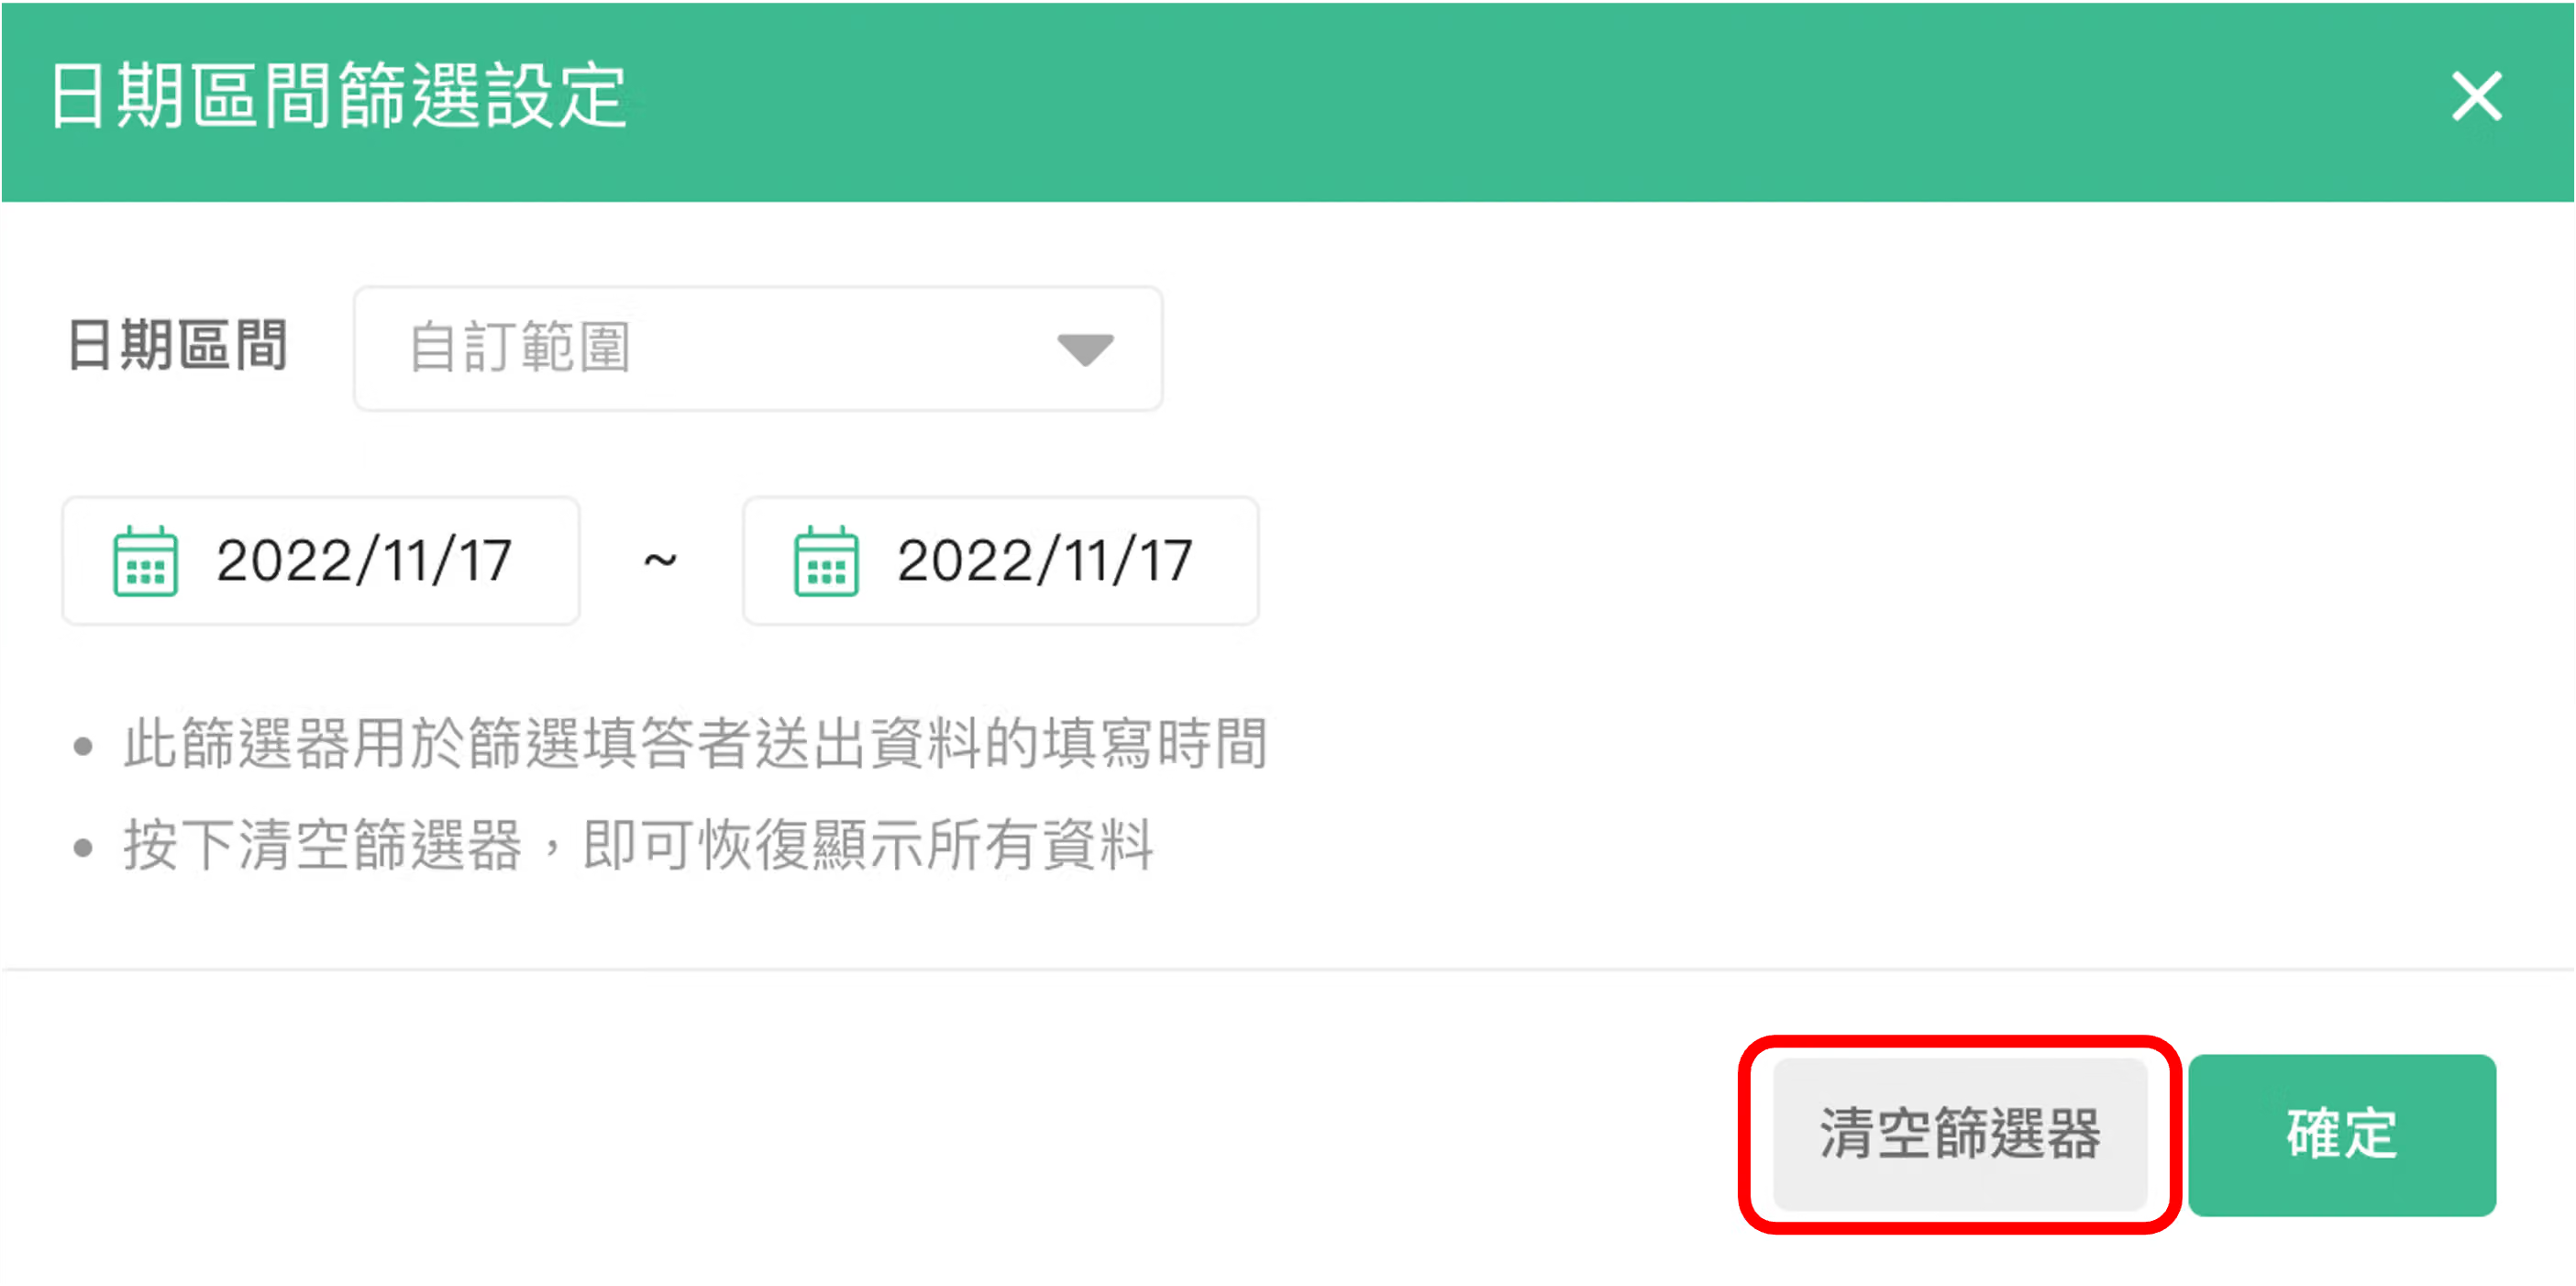
No. Currently, the date filter is based on the time the respondent submitted the survey. If you want to filter by the date a respondent entered in the survey, we recommend using the Filter feature.
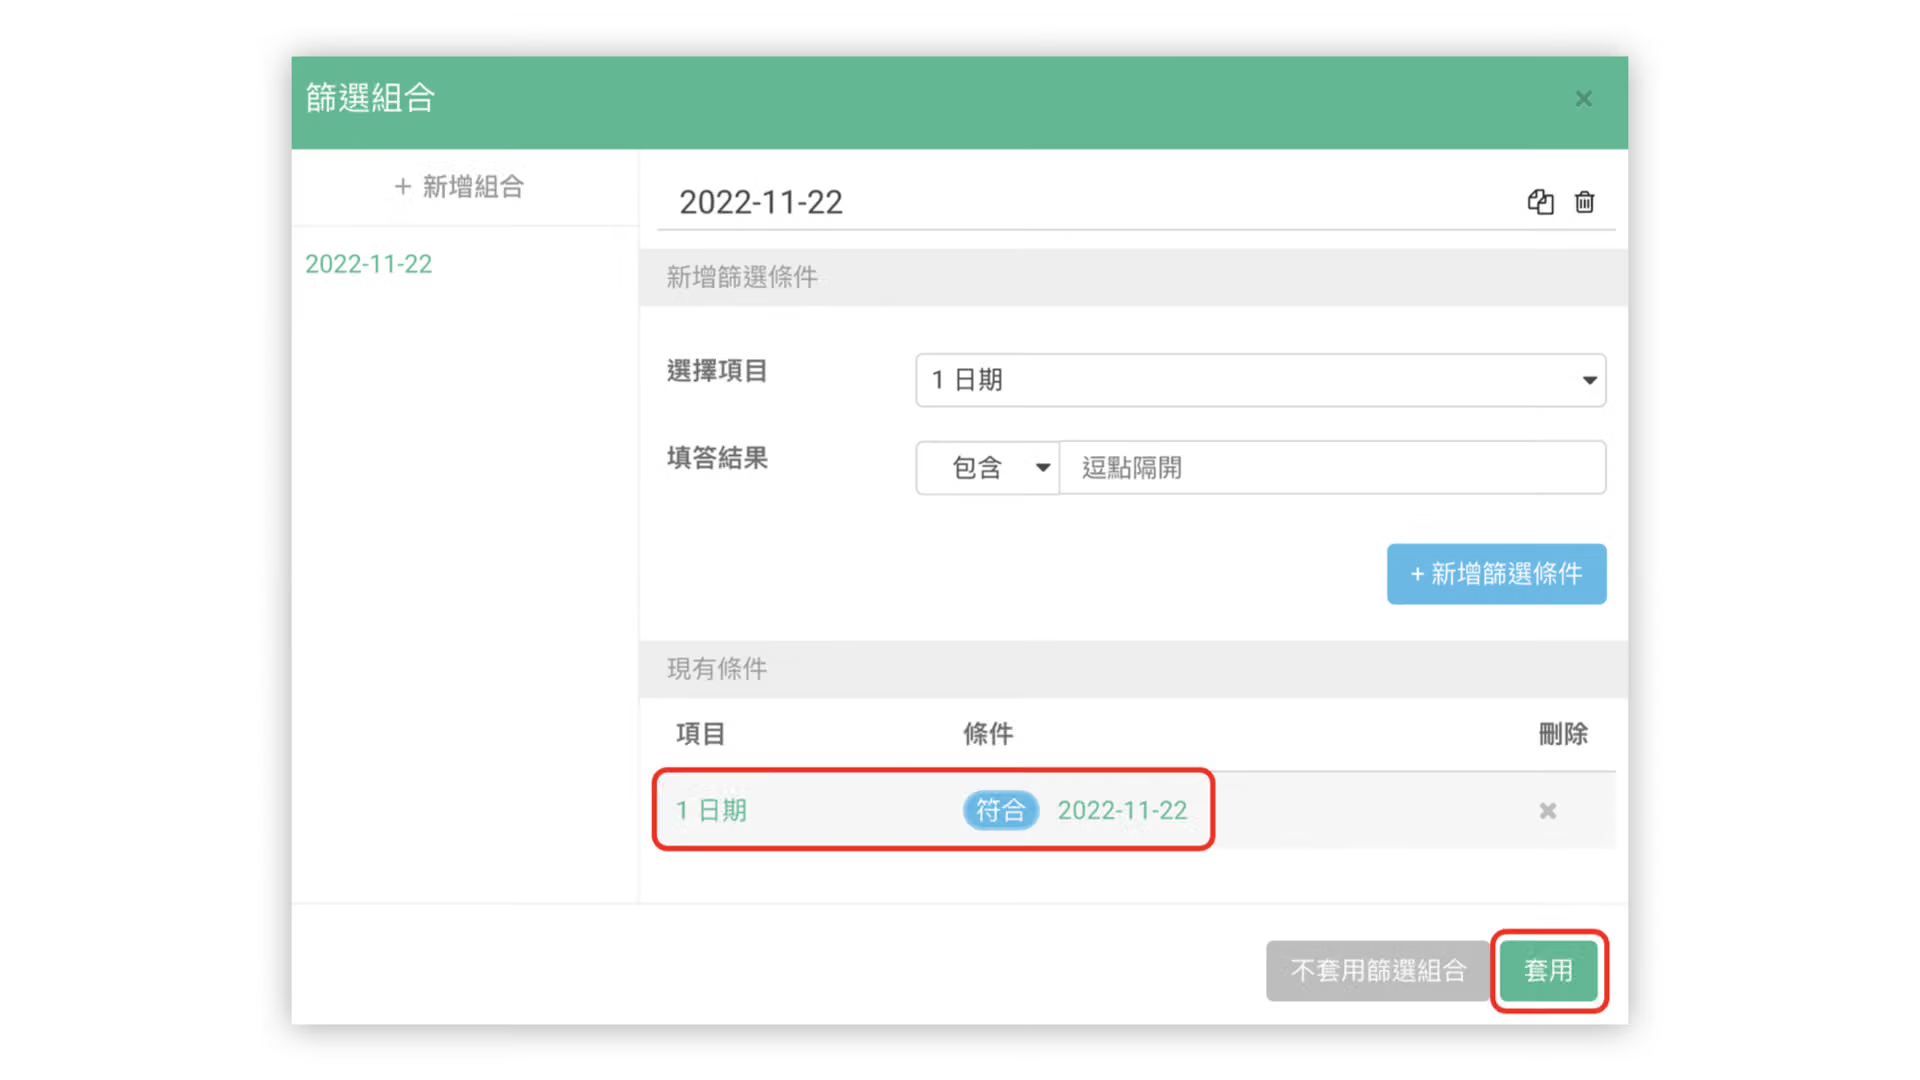
As shown in the image below, you can add a new filter combination to filter out all data where "2022/11/22" was entered in the date question.
The Date Filter helps designers understand sample performance over a specific period. It not only makes finding data more convenient but can also be applied to sample analysis at different times! When combined with the filter function, it allows you to add more conditions to the sample for that period, making data analysis and collection more accurate!