The Visitor Activity provides insight into surveys with its analysis of respondent information. It records data such as respondent numbers, devices used, browsers, countries, and operating systems, etc.
The overview section includes the following metrics:
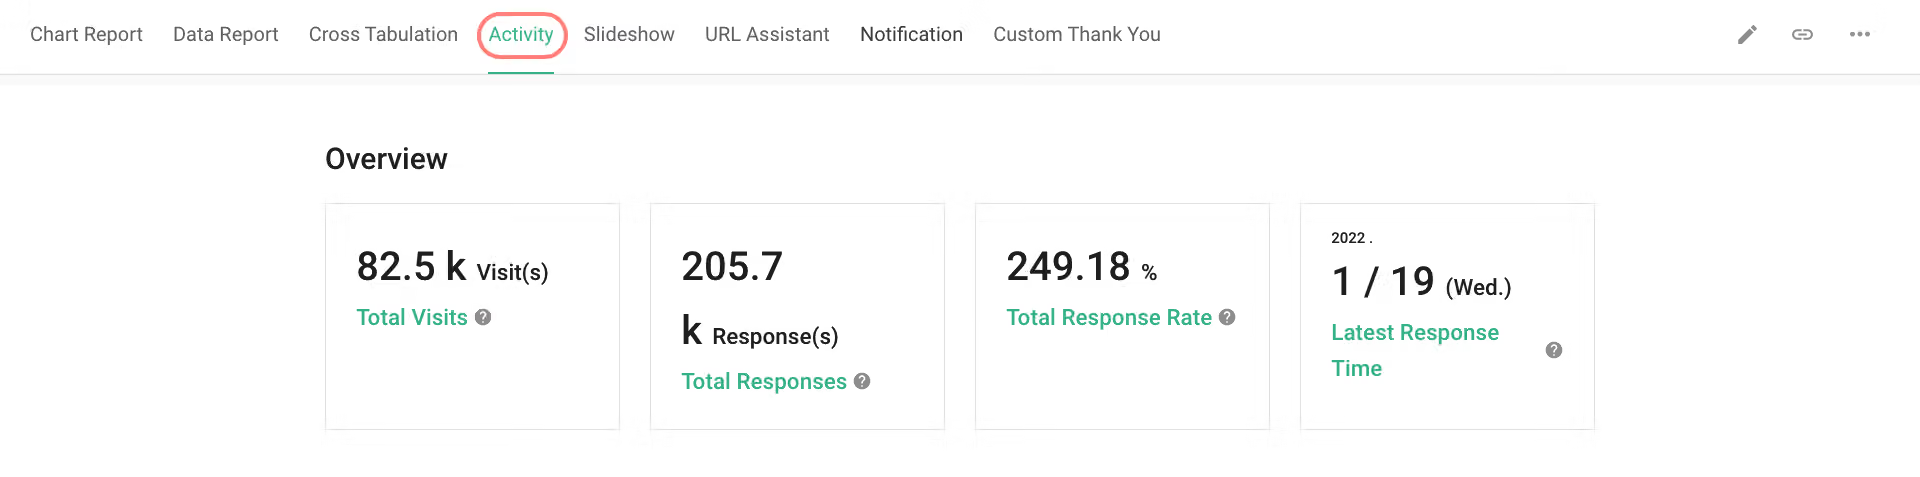
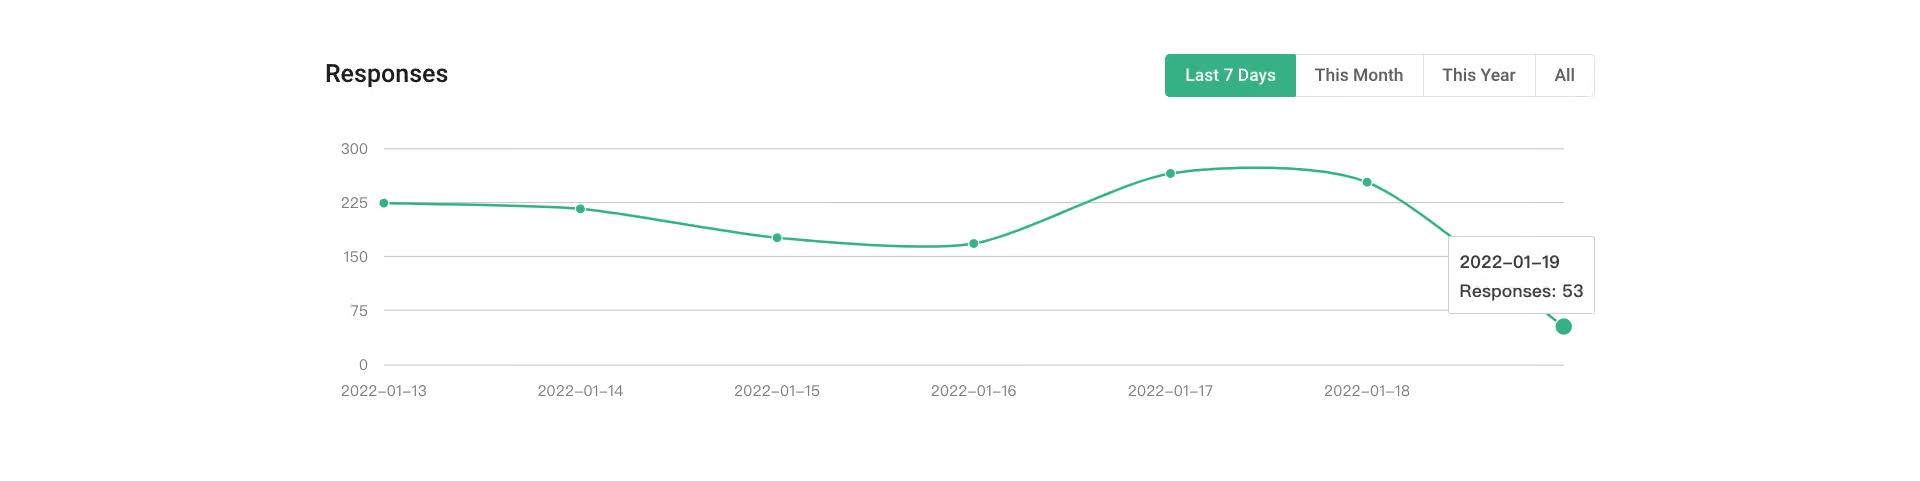
Respondent Statistics: The information panel at the top shows an overview of survey responses. The X-axis represents the date, and the Y-axis represents the number of responses. This chart allows you to clearly observe response trends over time.
For PRO plans and above, the Visitor Activity page includes the Question drop-off rate, allowing you to identify which questions are most likely to cause respondents to exit the survey.
The table displays view and drop-off metrics for each question, including:
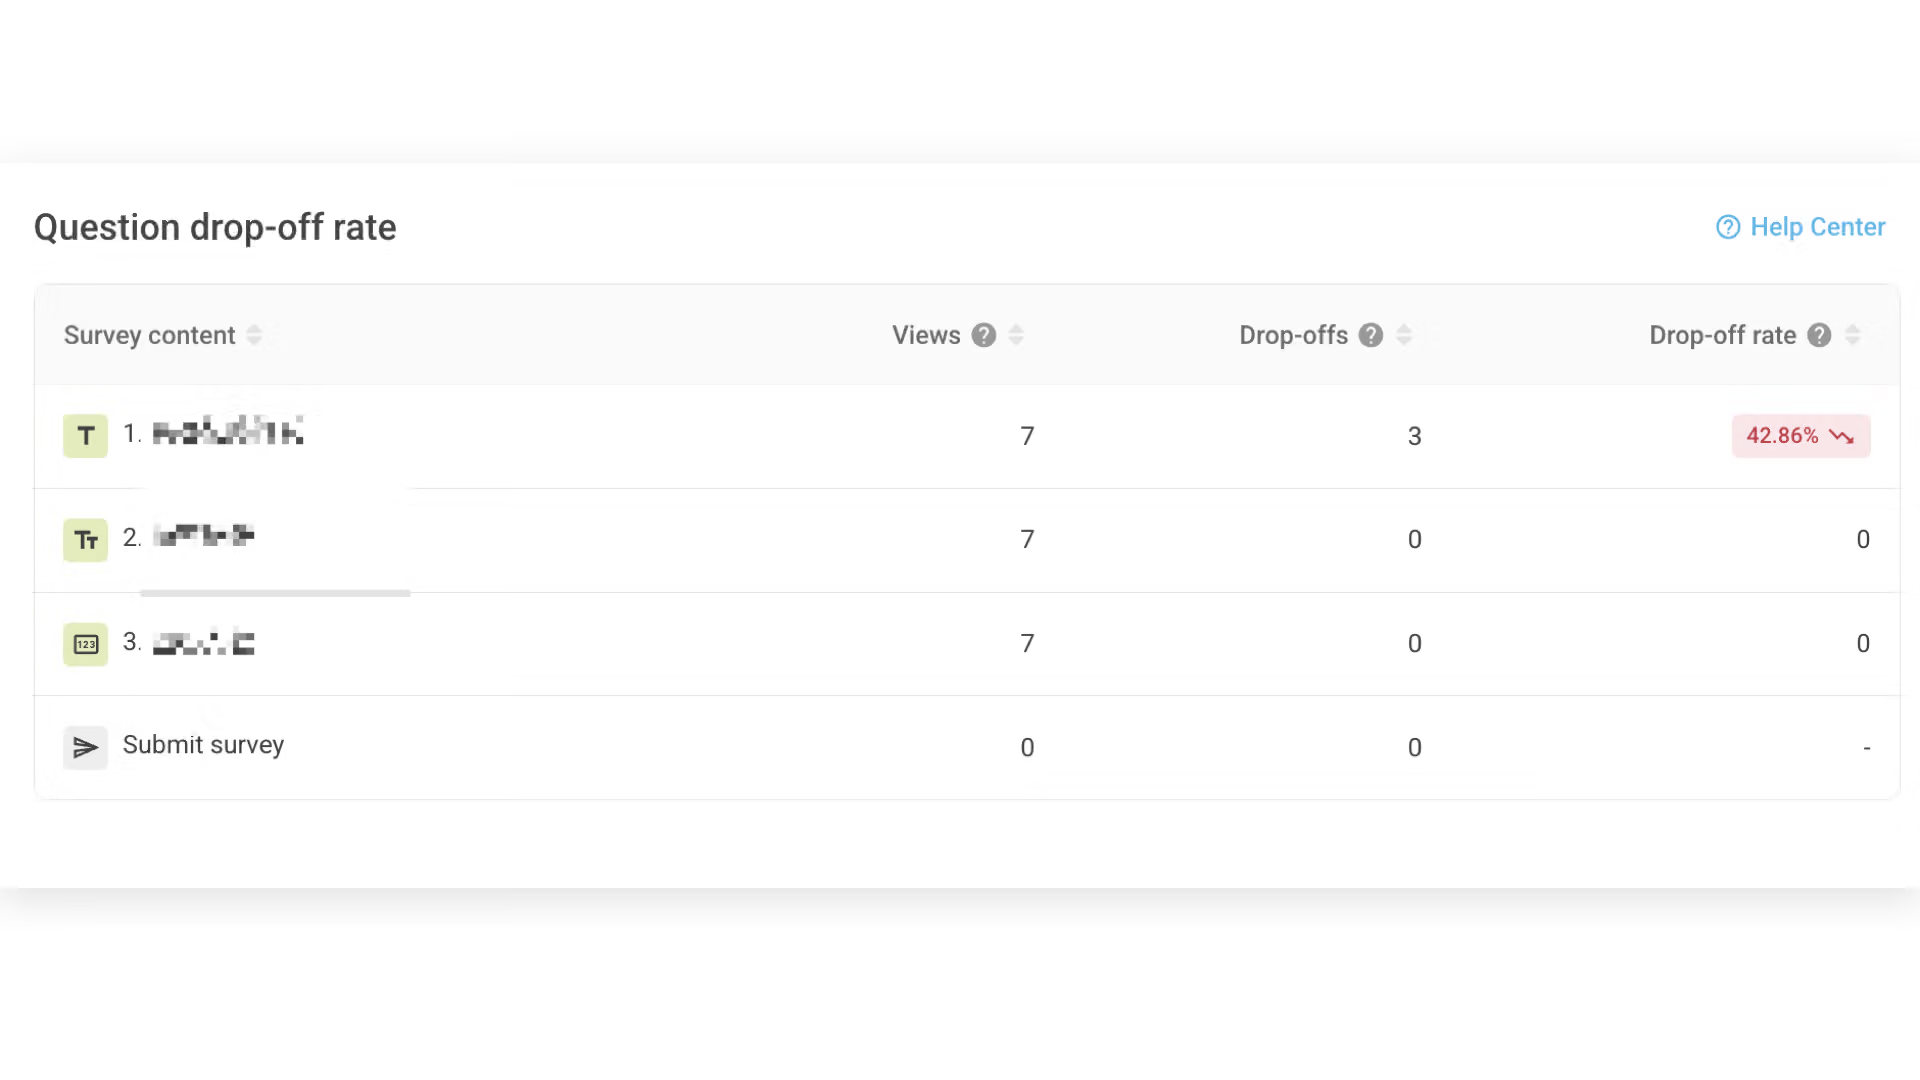
Calculation Method
By analyzing the Question drop-off rate, you can quickly identify which questions are more likely to cause respondents to discontinue, providing a clear basis for optimizing survey flow and question design.
With Visitor Activity, you can eliminate the need to separately investigate respondents’ survey usage behavior and easily gain insights into respondent profiles.