Easily monitor account numbers, response count, and other information to help businesses manage their survey usage effectively!
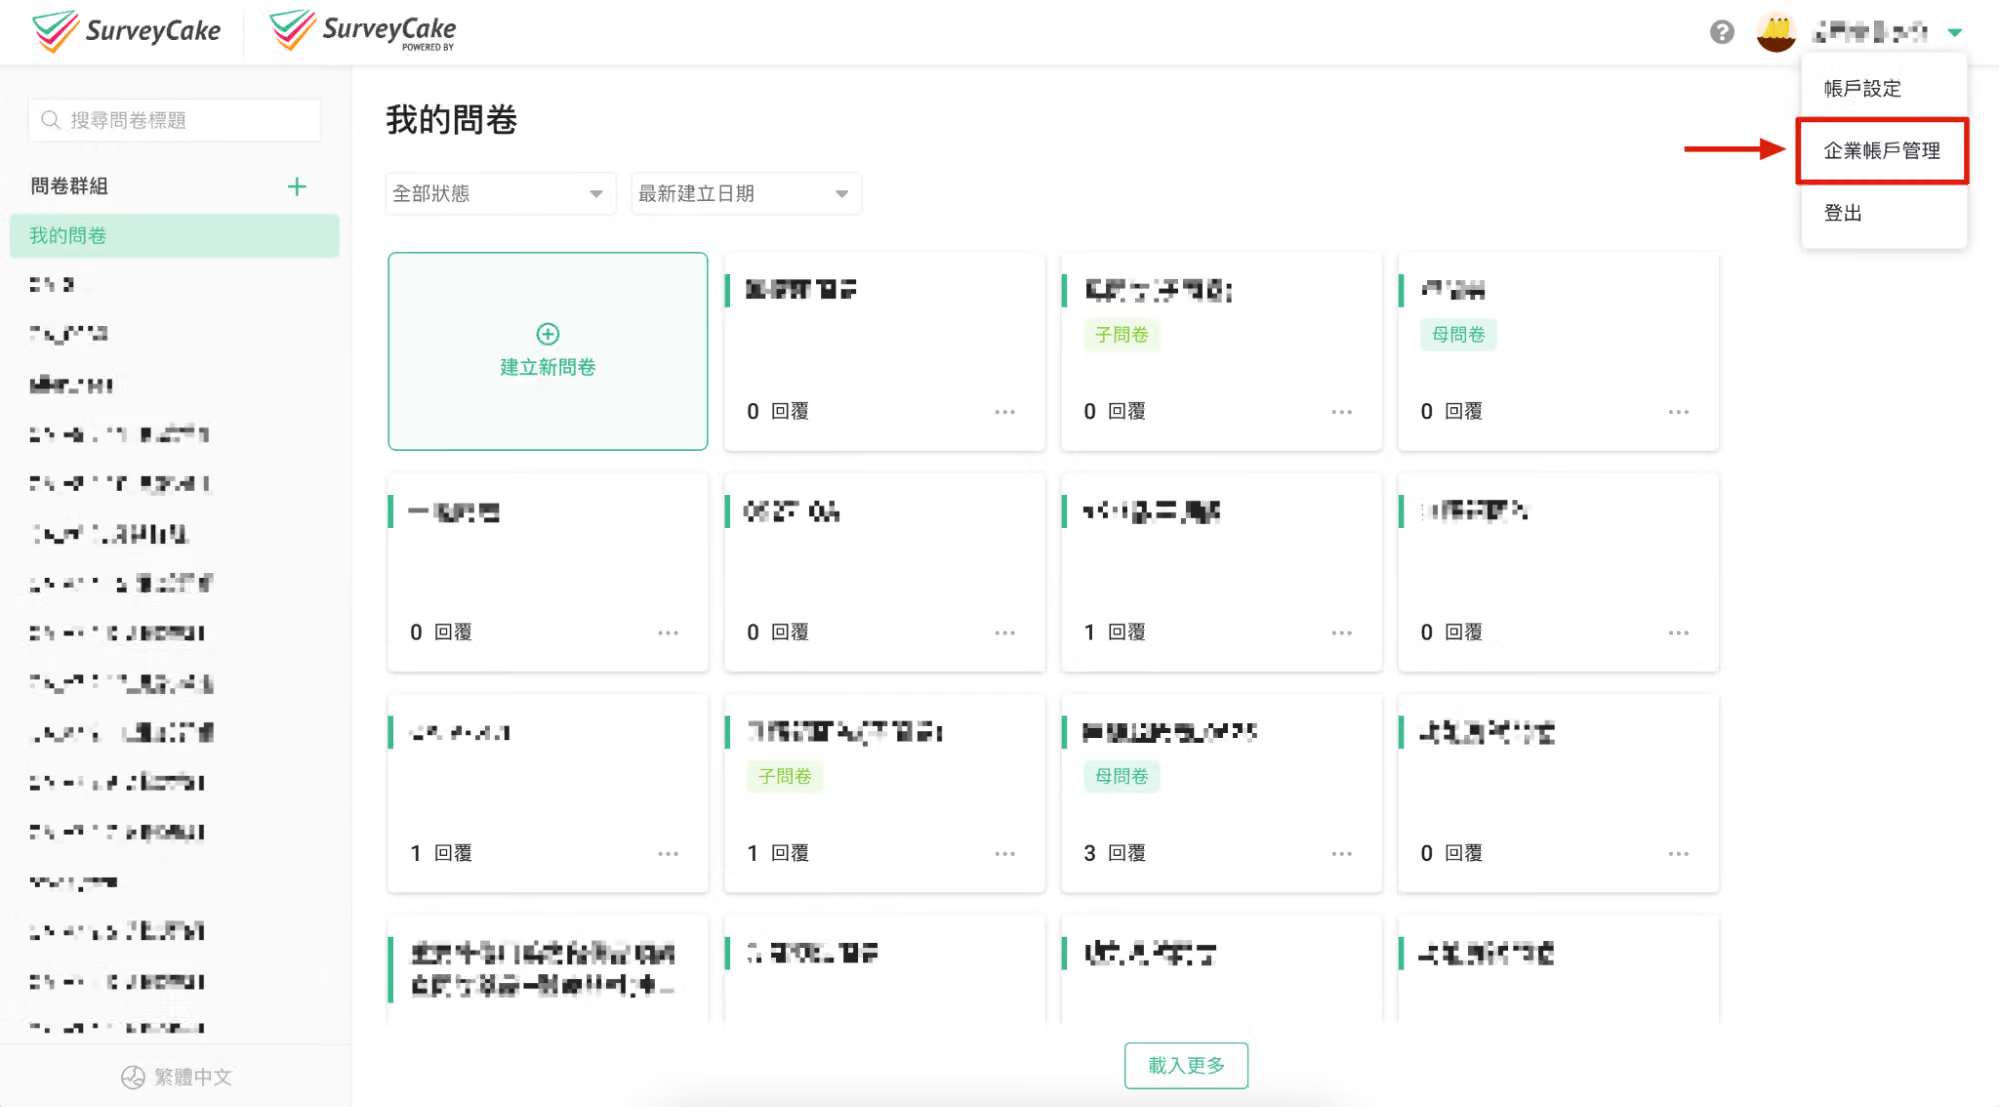
After entering the ENTERPRISE, click on the dropdown menu in the upper right corner and select "Enterprise Account" to access the ENTERPRISE dashboard. The dashboard consists of six tabs, which will be detailed below.
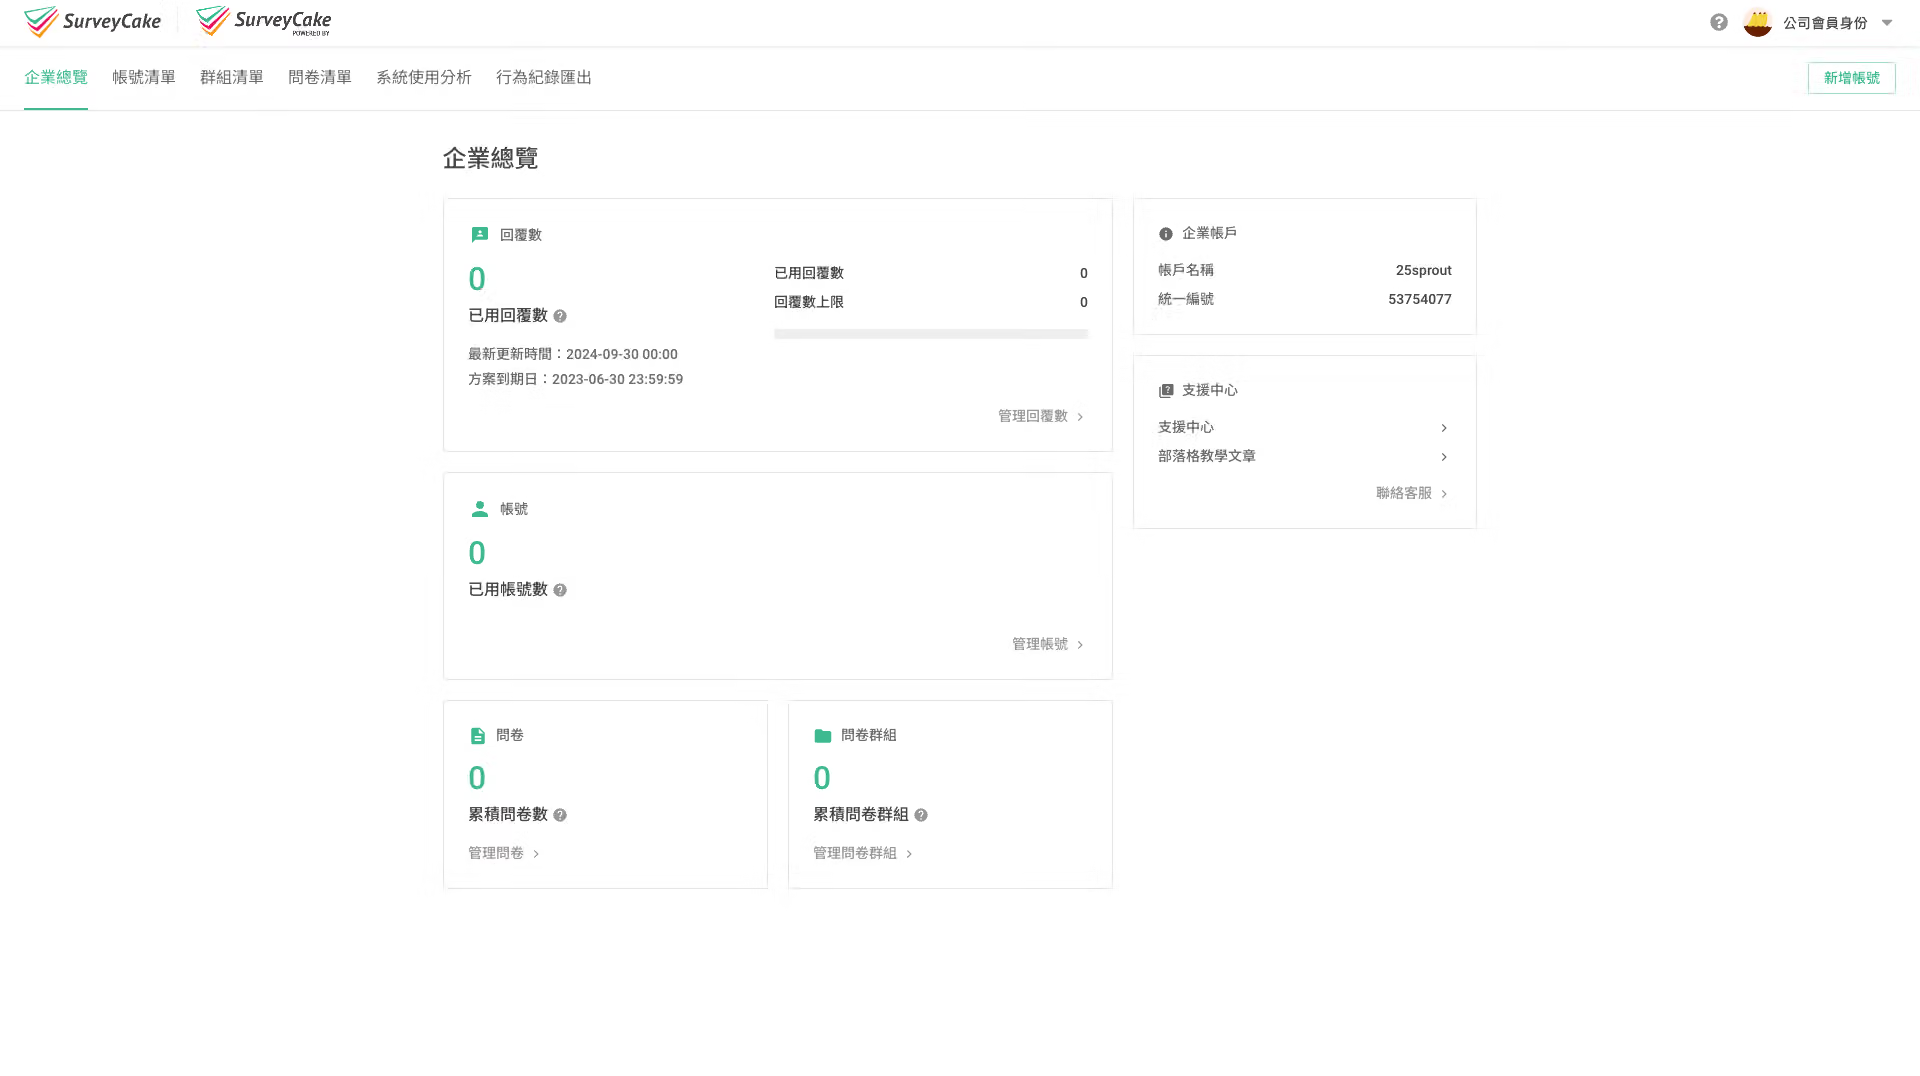
In the "Account Overview" page, users can view basic information about their organization:
This feature allows businesses to grasp their usage status quickly regarding response count and account numbers, enabling timely adjustments.
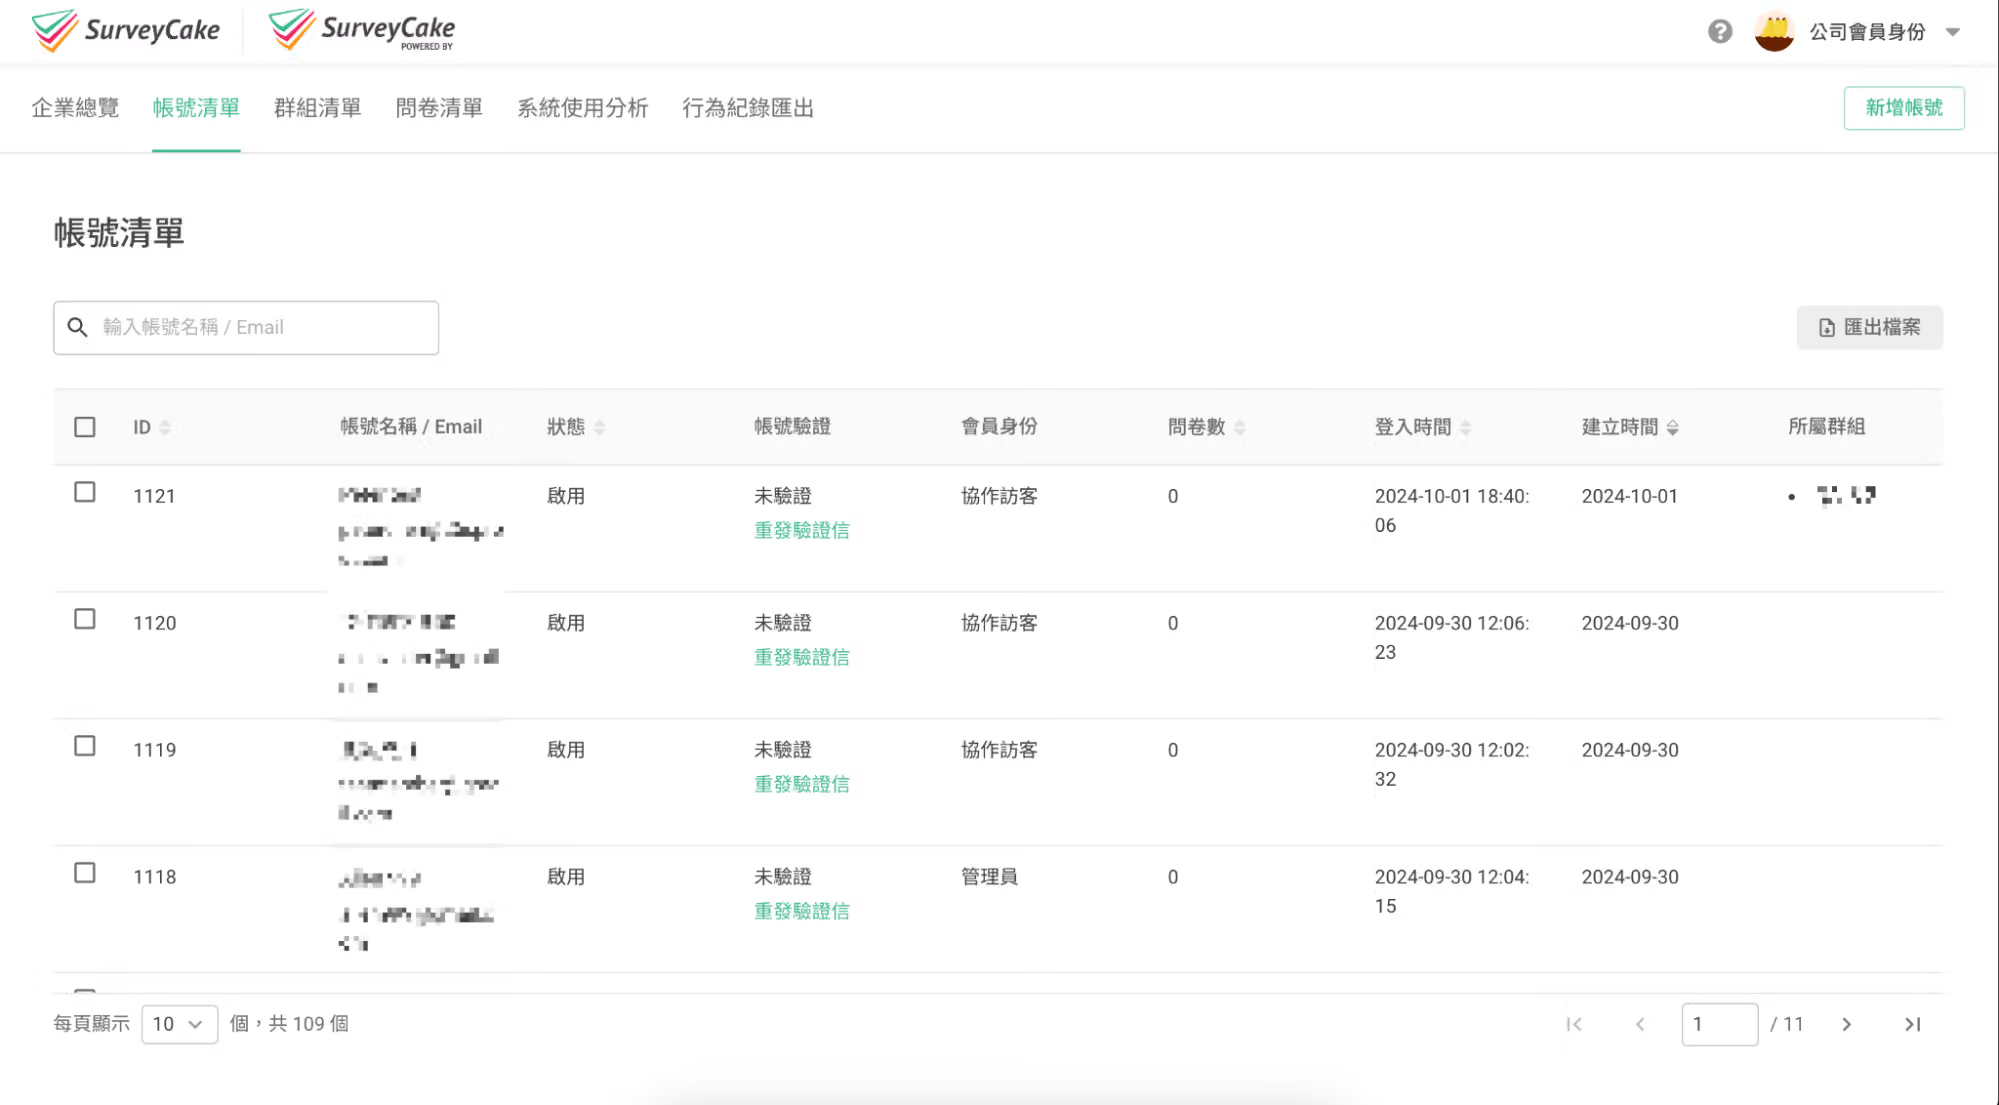
In the "User Report" page, accounts with "Super Admin" or "Admin" permissions can view all users under the ENTERPRISE. This section provides quick access to user information, including account names, emails, membership status, and the number of surveys created.
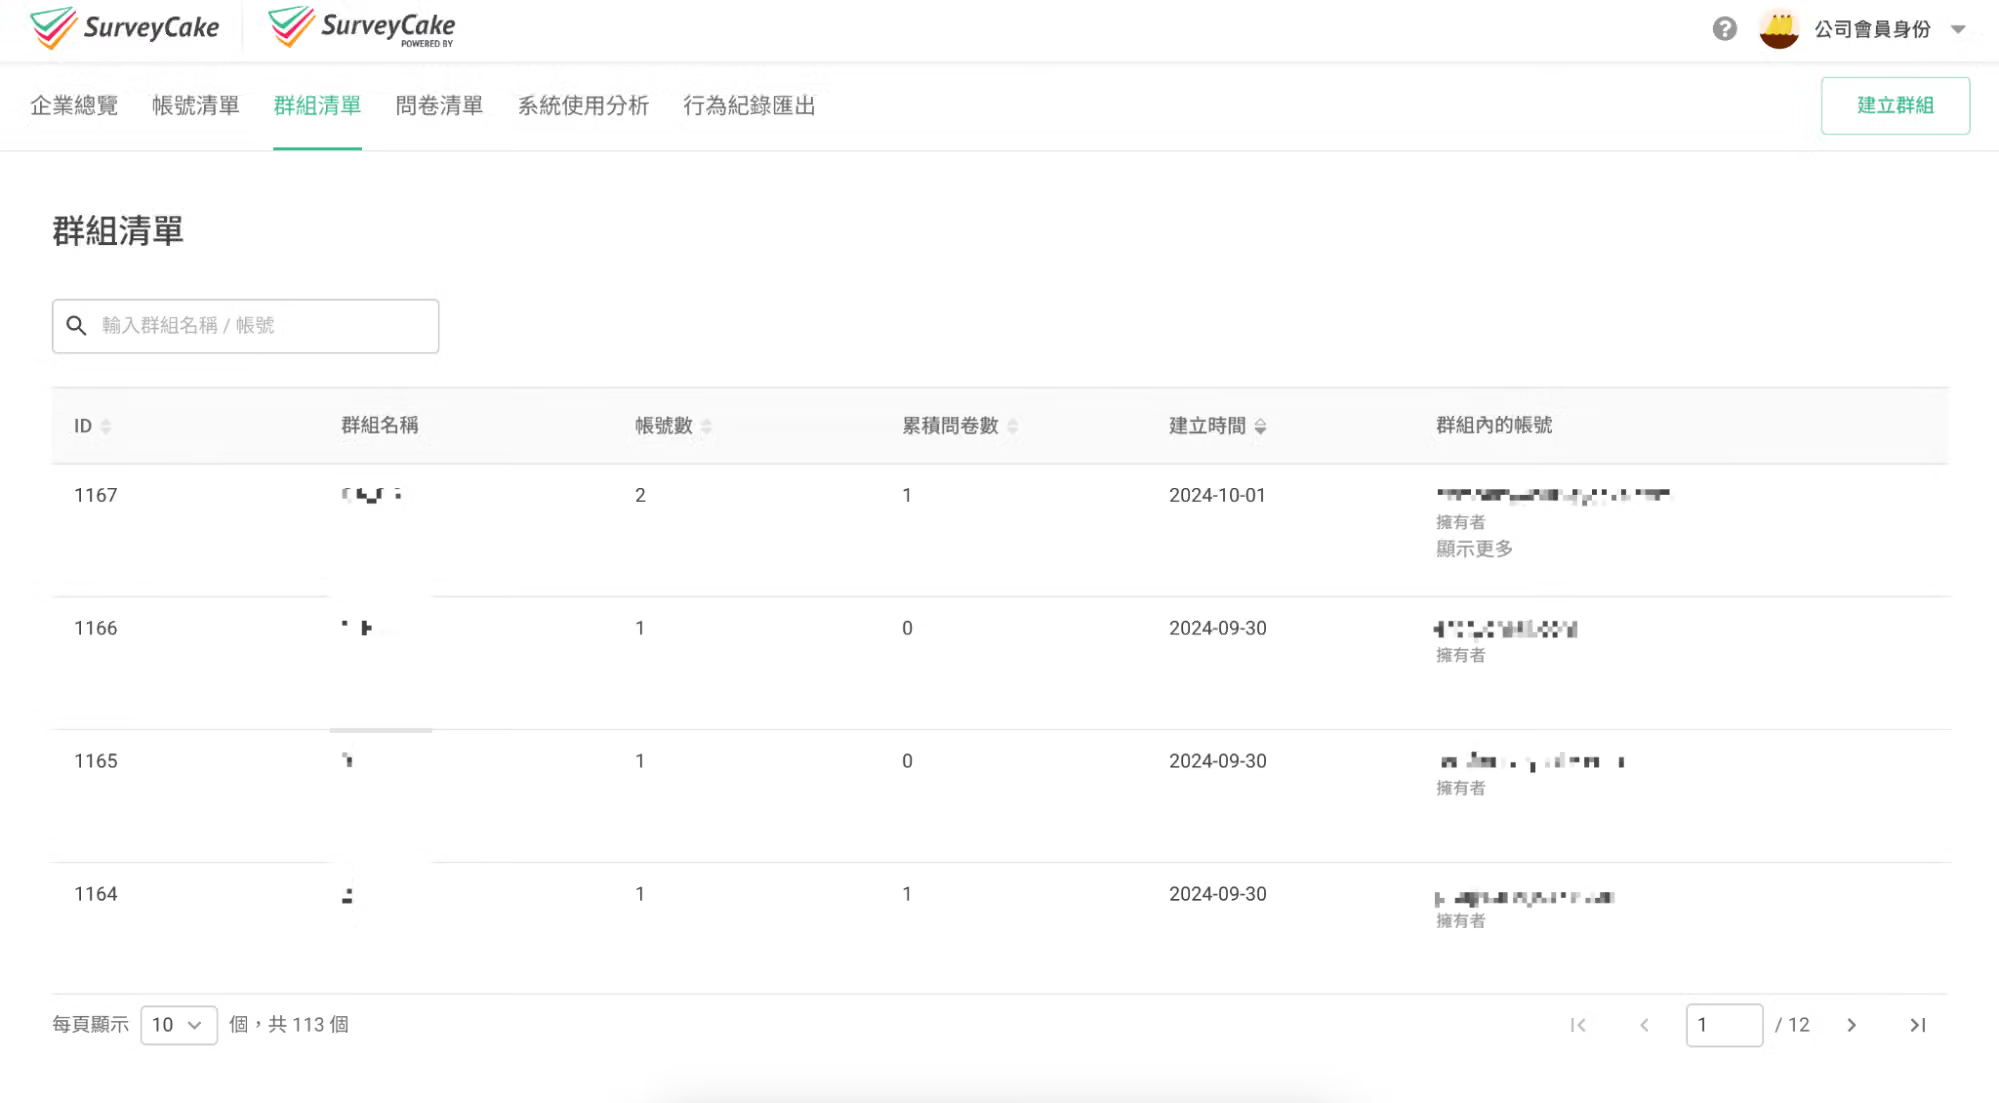
On the "Group Overview" page, accounts with "Super Admin" or "Admin" permissions can see all groups under the ENTERPRISE, including both joined and unjoined groups. Users can quickly check basic information about each workspace, such as workspace names, the number of accounts in each group, and total surveys accumulated within those groups. This helps "Super Admin" or "Admin" understand the status of various groups within their ENTERPRISE more conveniently.
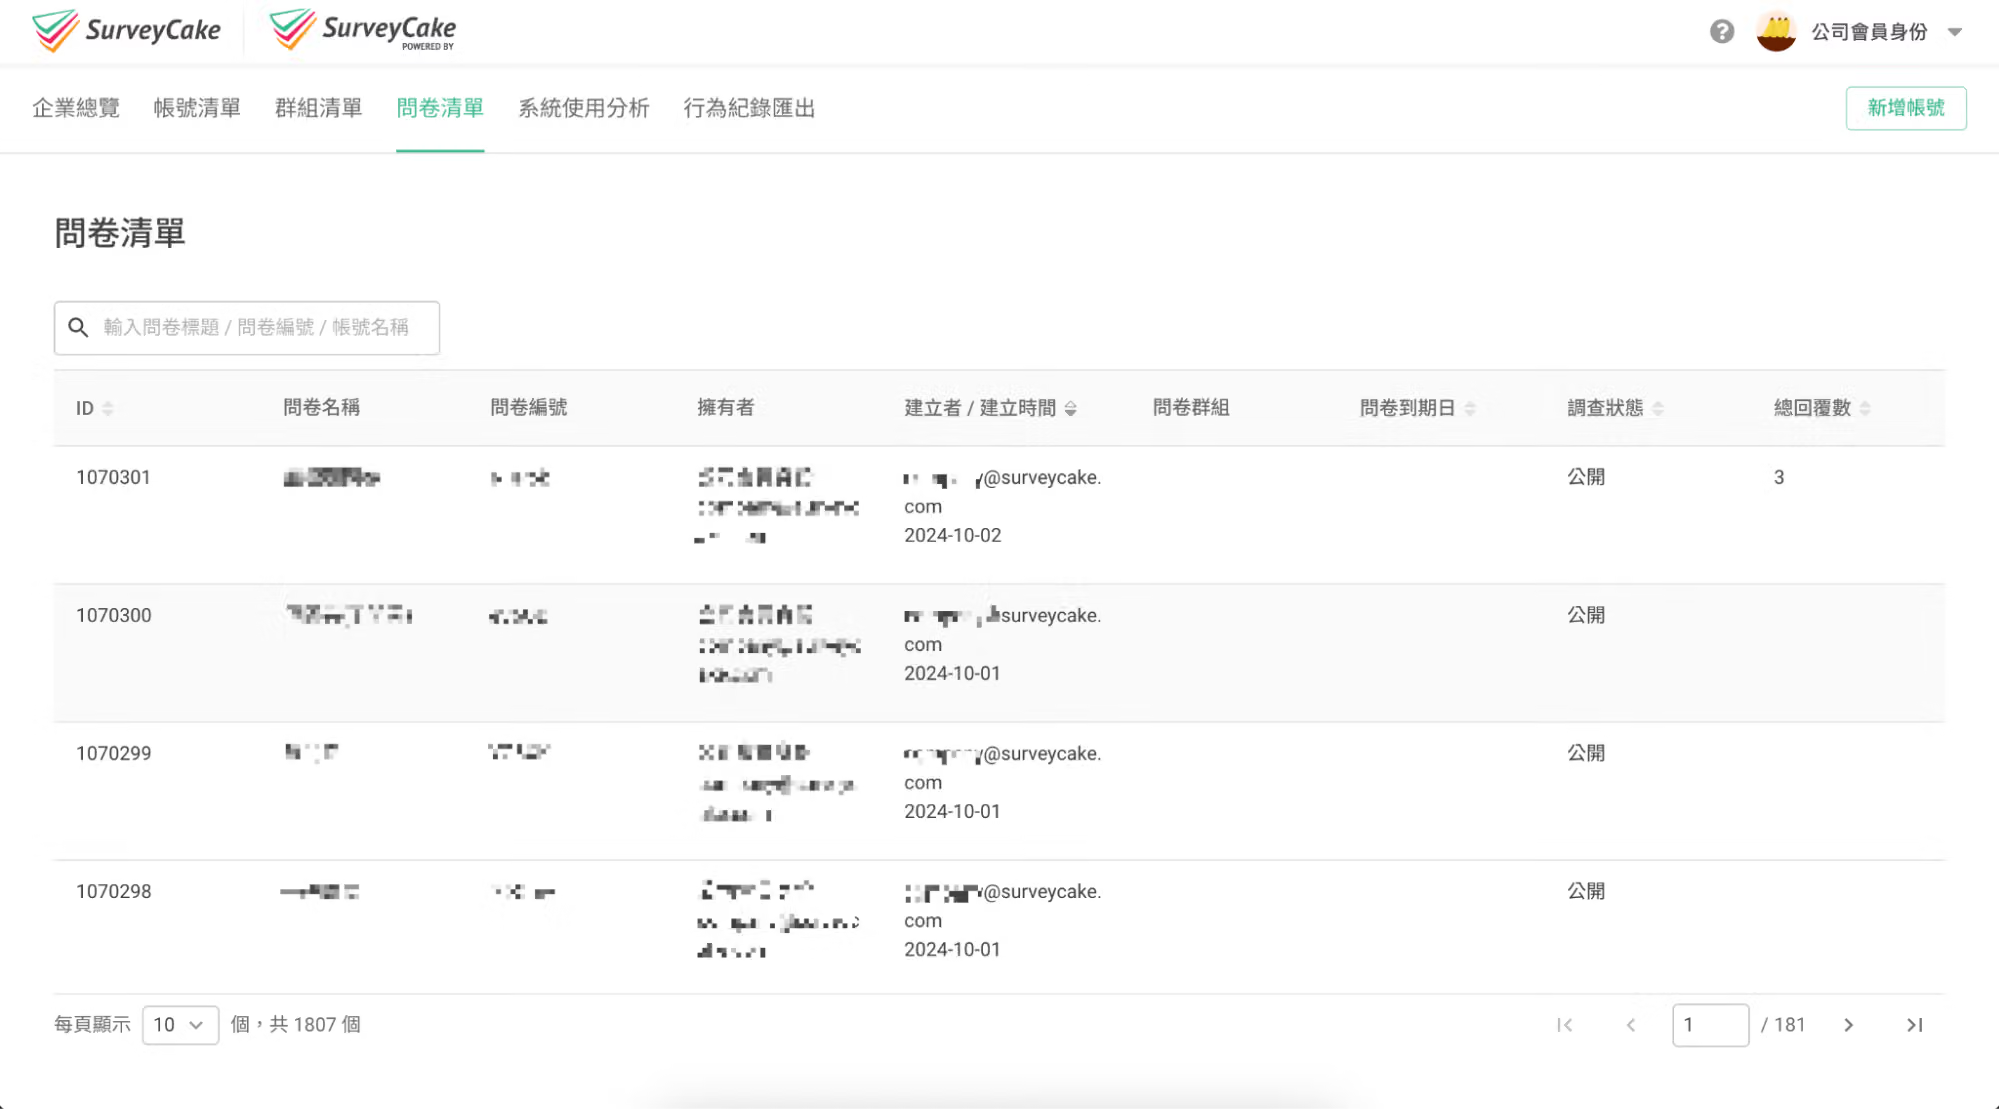
In the "Survey Data Report" page, accounts with "Super Admin" permissions can view all surveys under the ENTERPRISE. This tab allows "Super Admin" to quickly access relevant information about all surveys within the organization, including survey names, IDs, owners, creators, statuses, and total responses received (including deleted ones). This functionality enables businesses to review detailed information about all surveys at once and easily monitor each survey's status.
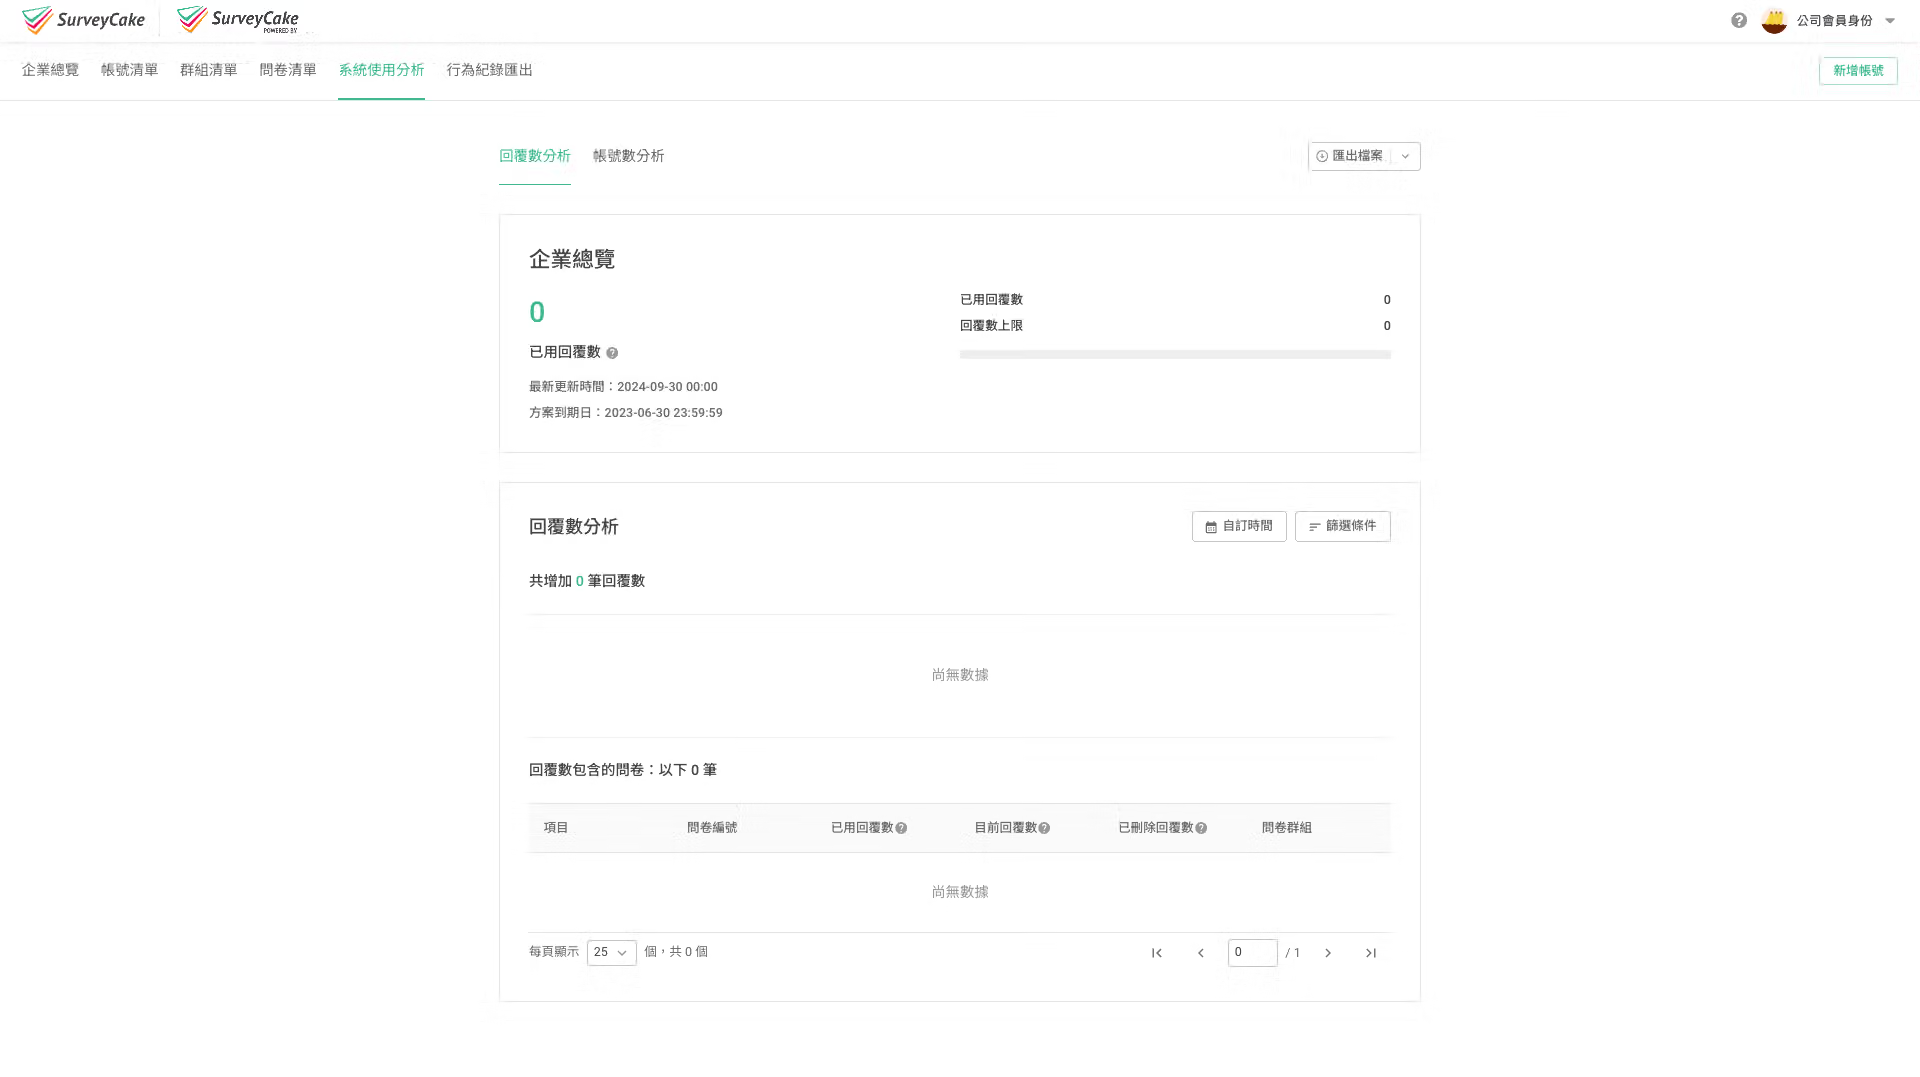
In the "User Analysis" page, accounts with "Super Admin" permissions can toggle between two subpages: "Response Analysis" and "Account Analysis." This page allows businesses to quickly understand system usage and analyze individual usage patterns based on specific time frames or filters.
In the "Response Analysis" subpage, users can view the overall responses from the ENTERPRISE and the maximum authorized response limit. Additionally, they can apply specific filters or custom time frames to see how response usage varies over time. Users can also export data as CSV or XLSX for further analysis.
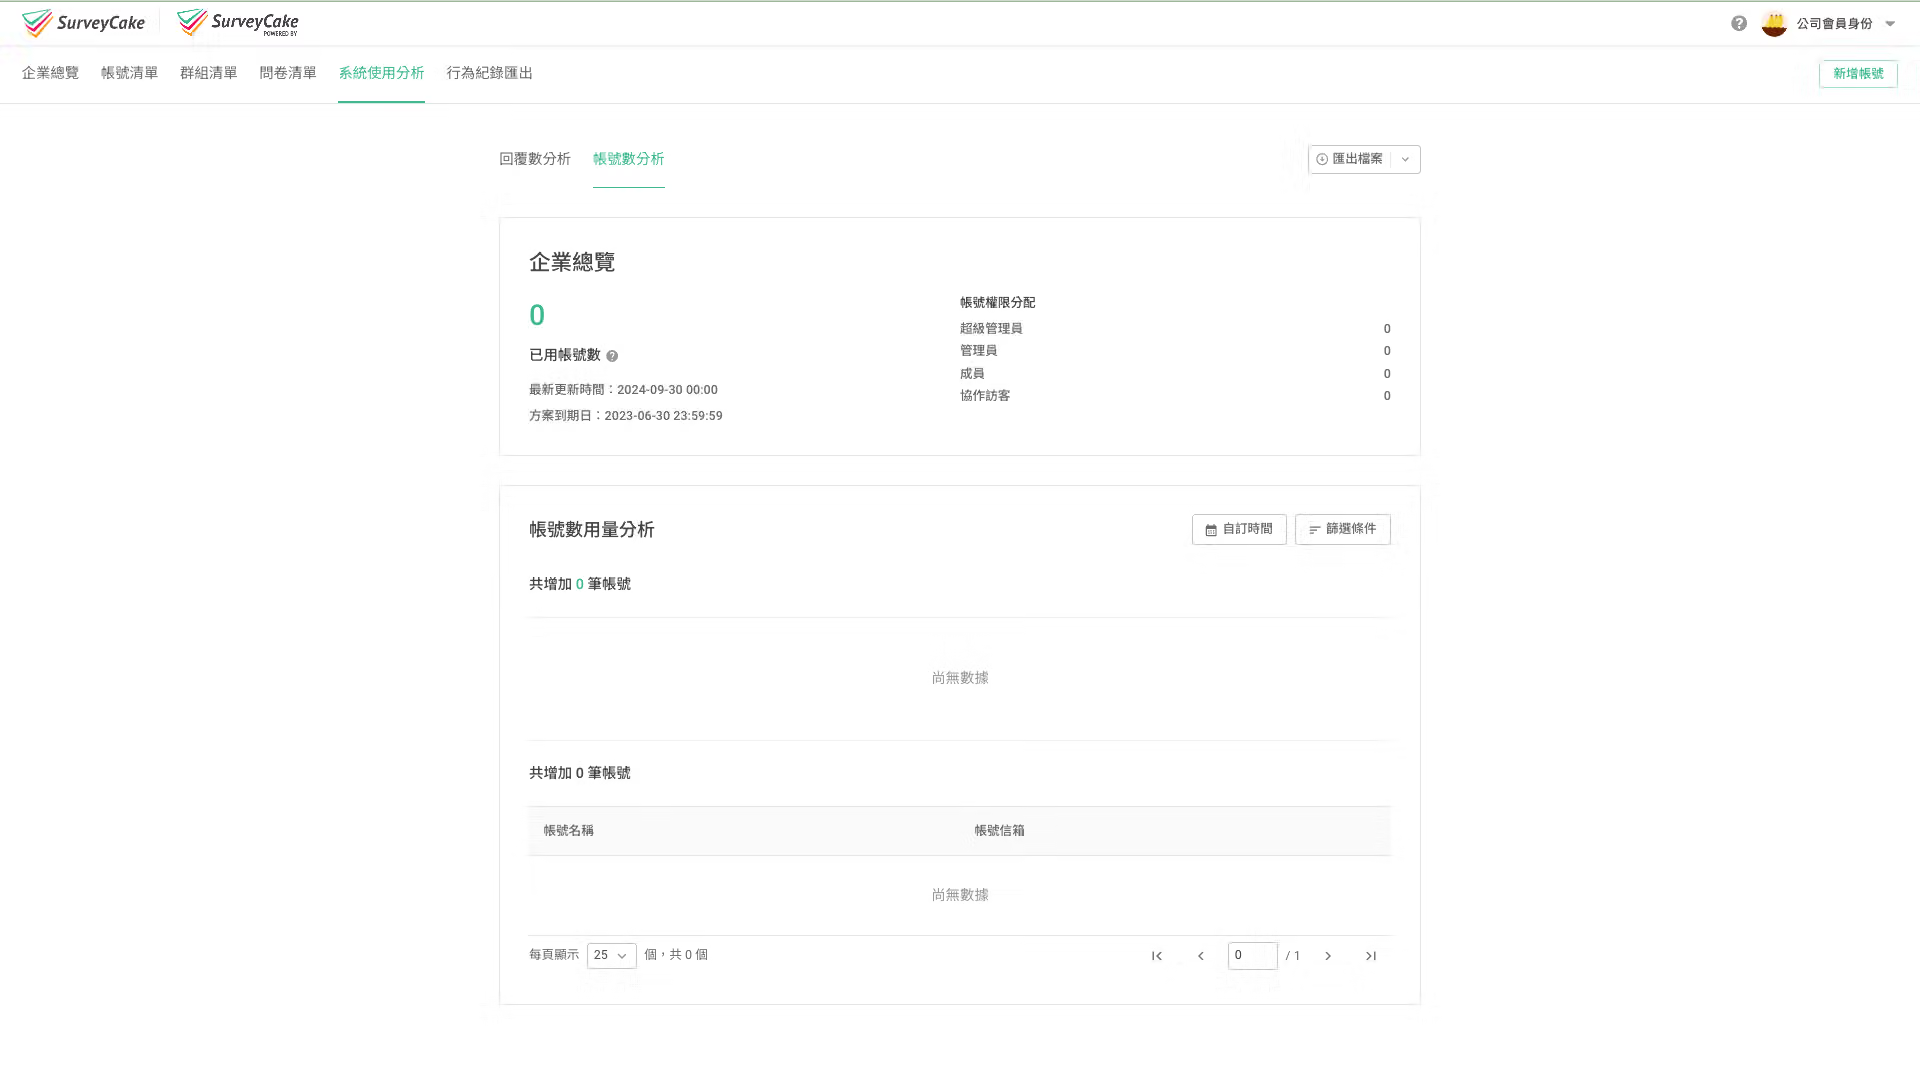
In the "Account Analysis" subpage, users can view the total number of activated accounts in the ENTERPRISE along with the maximum authorized account limit. They can also apply specific filters or custom time frames to understand account usage over time. Exporting data as CSV or XLSX is also available for detailed insights.
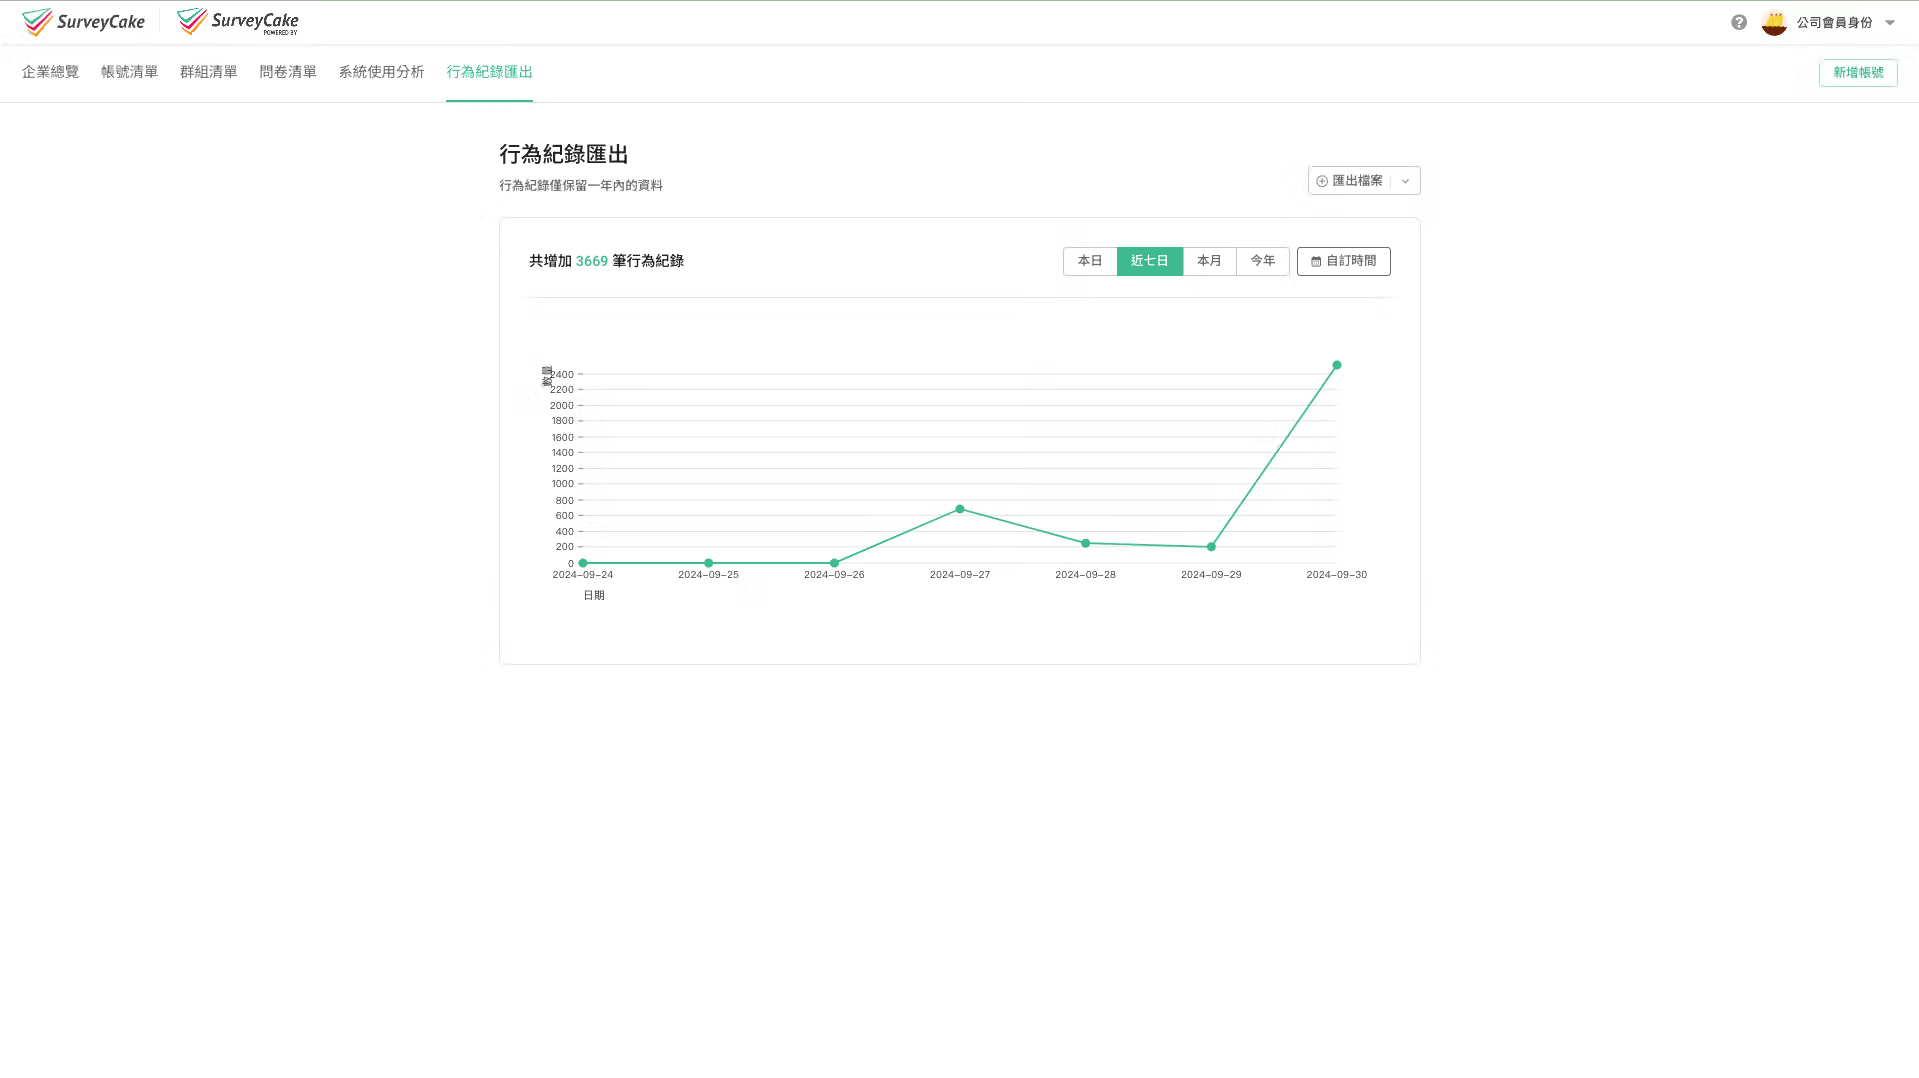
In the "Export User Log" tab, accounts with "Super Admin" permissions can export all behavior records at once:
This export function makes it easy to identify who edited or deleted which surveys or groups. It also helps monitor user behavior to ensure internal information security.
If you are interested in this feature, please Contact Us for more information.
Summary
With the ENTERPRISE dashboard, businesses can easily grasp their overall usage situation and unlock the full potential of surveys!