SurveyCake's backend data system not only visualizes the data but also provides diversified analysis functions to further analyze the data, the profile of respondents, and to obtain high-quality data insights.
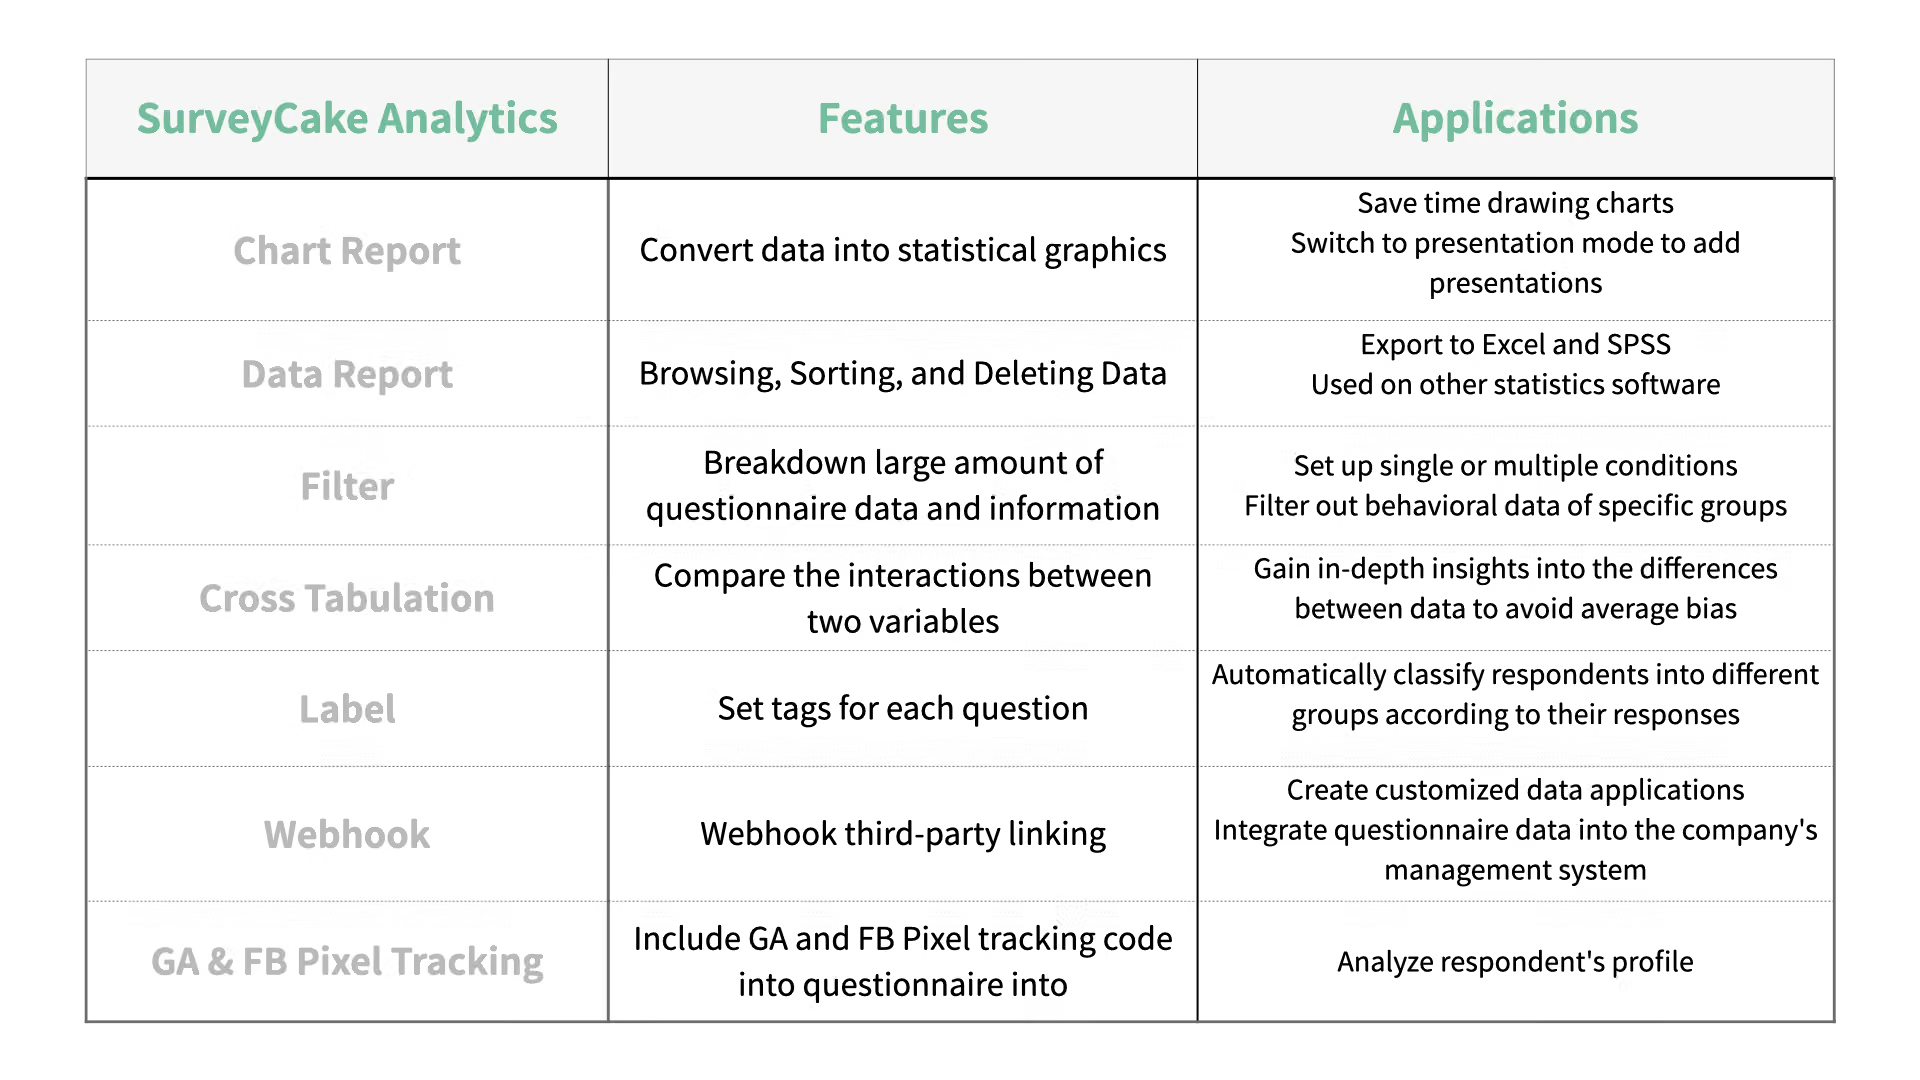
1. Chart Report: Visualize questionnaire data
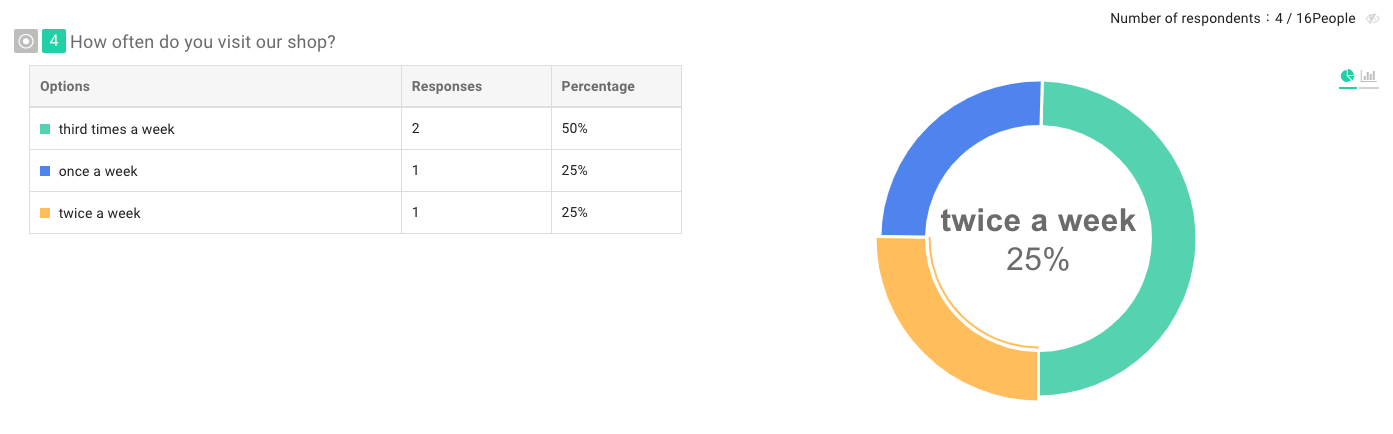
SurveyCake's backend data system will directly convert respondents' responses into statistical data and visualize it, and run corresponding analysis charts for different question types, which will show the analysis results at a glance.
SurveyCake provides 6 different types of statistical results:
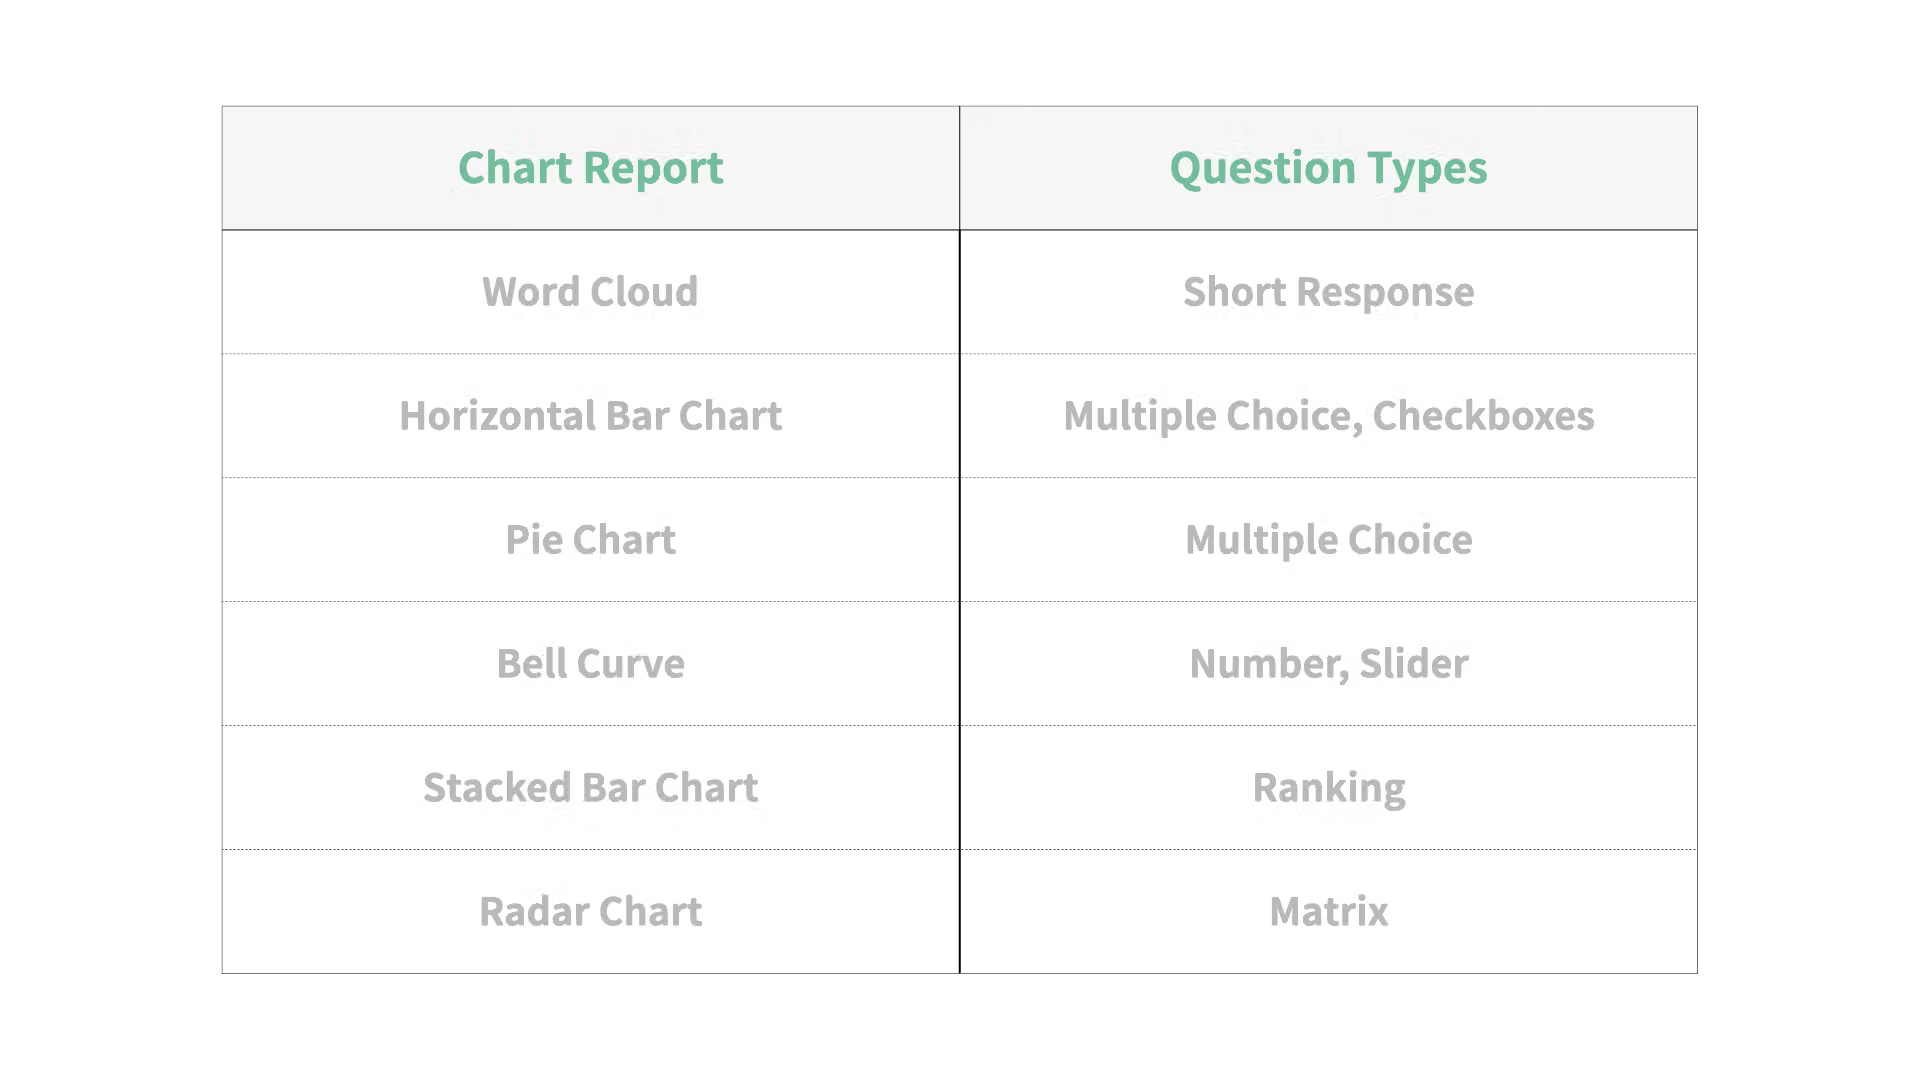
At the same time, you can also convert the "Chart Report" into the "presentation mode" to show each question's chart individually, then download the pdf format or copy-paste them directly into your presentation to save you time from doing the statistics and drawing the charts.
2. Data Report: Export data to Excel and SPSS for follow-up analysis
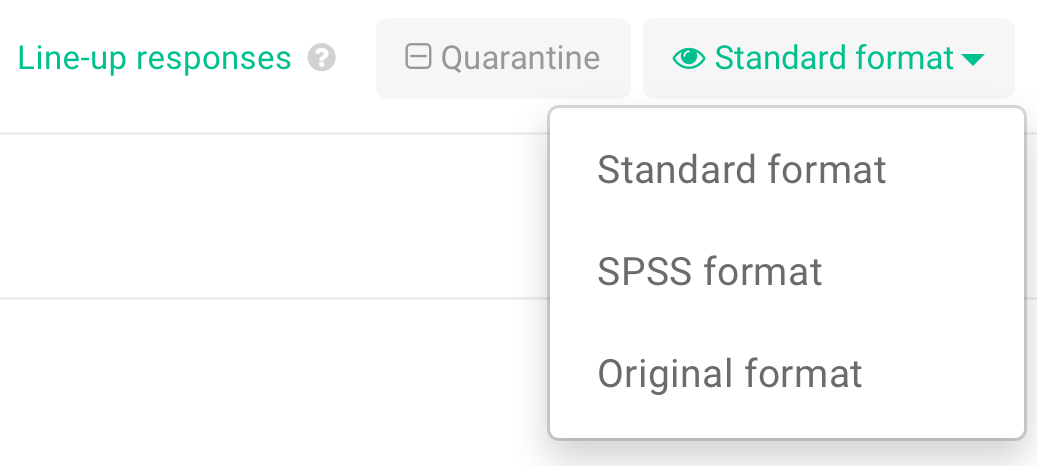
Use SurveyCake's "Data Report" to browse, sort, and delete data, as well as switch browsing. If you want to keep a hard copy, you can also download an Excel file and print out a backup copy.
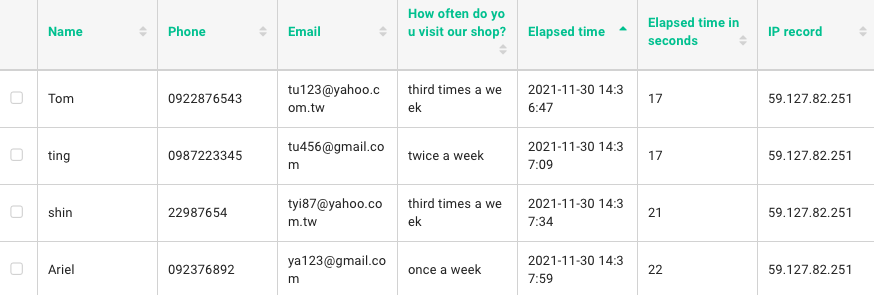
If you want to have further applications of the questionnaire data, you can also download the SPSS file, and then import them into any professional software for analysis.
3. Filter: Easily breakdown large data
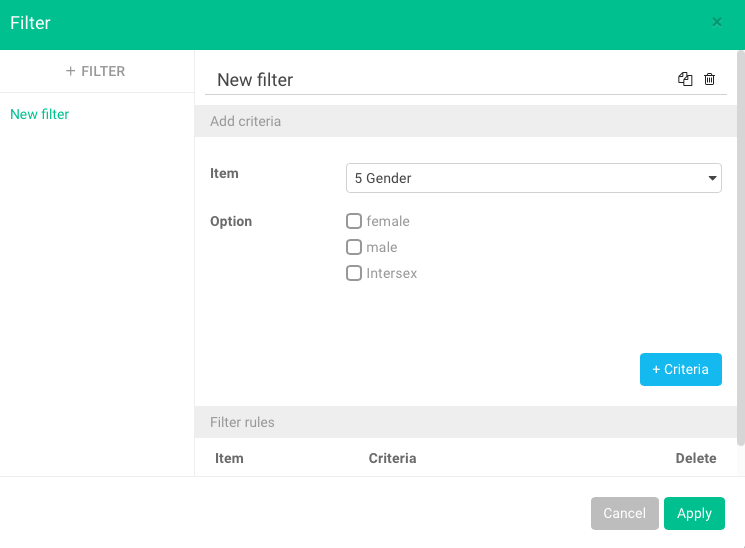
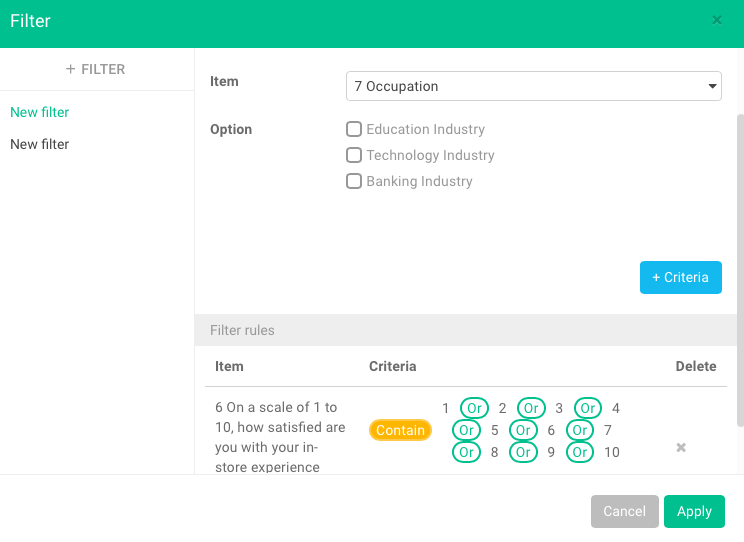
By using "Filter", you can have more accurate data insights and analysis of specific groups, which could be helpful for future marketing strategy planning and product optimization.
You can set "single condition" or "multiple conditions" to narrow the scope of the data and quickly analyze the behavior of a specific group.
4. Cross Tabulation: Avoid average bias
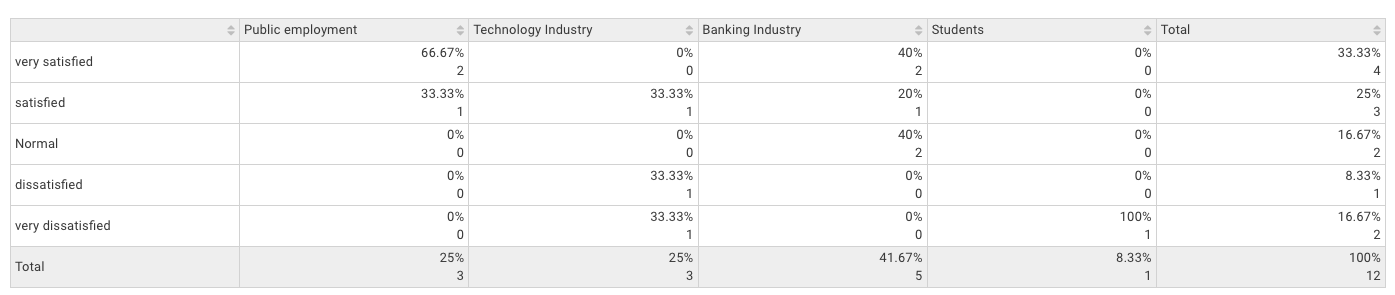
SurveyCake's "Cross Tabulations" uses the "Comparison" principle to analyze the relationship between two variables. It presents the results in the form of a "Cross Analysis Chart" to help you with clearer observation of the comparison results.
When doing data analysis, if you only look at a certain value or indicator to determine the result, other potential responses would be scaled down by average. This might affect the marketing strategy and product optimization in the future. To avoid this situation, you could use "Cross Tabulations" and select the "Base Question" and "Control Question" functions. It will demonstrate the cross-relationship between the two options in the form of graphs and tables.
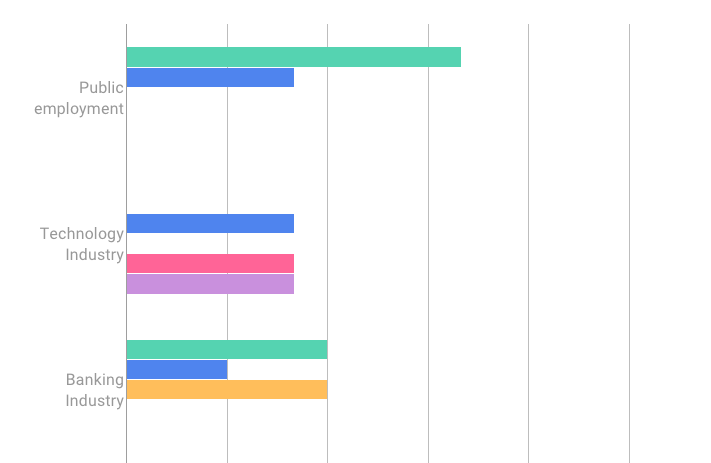
Looking at the graph below, the overall satisfaction average lies between "normal" and "satisfied".
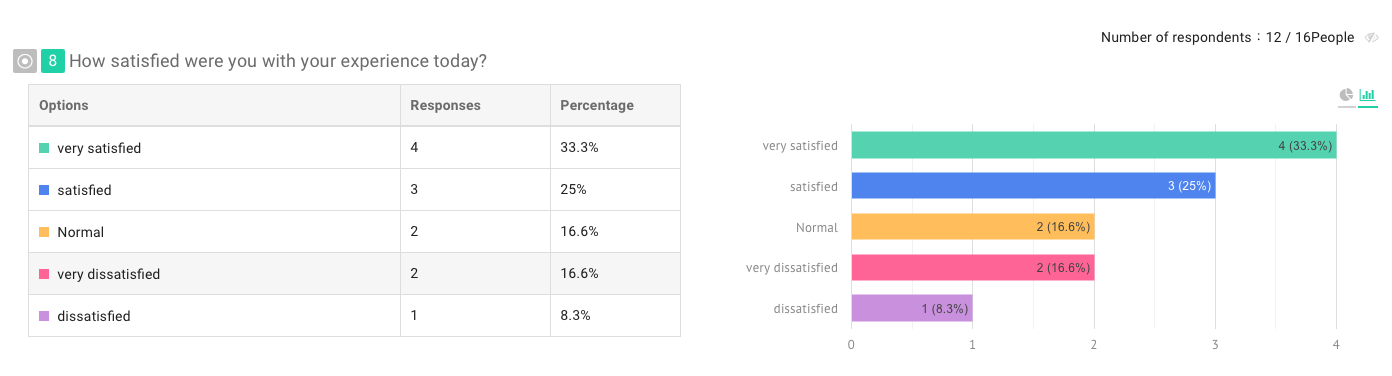
However, if we cross analyze the interaction between "occupation" and "user satisfaction level", we will find that "students" and "technology industry" tend to answer between "dissatisfied" and "very dissatisfied". This way, the company could reflect on whether their products suit these two groups or if there are any adjustments that need to be done.
5. Combined Analysis: Conveniently compile subsurvey
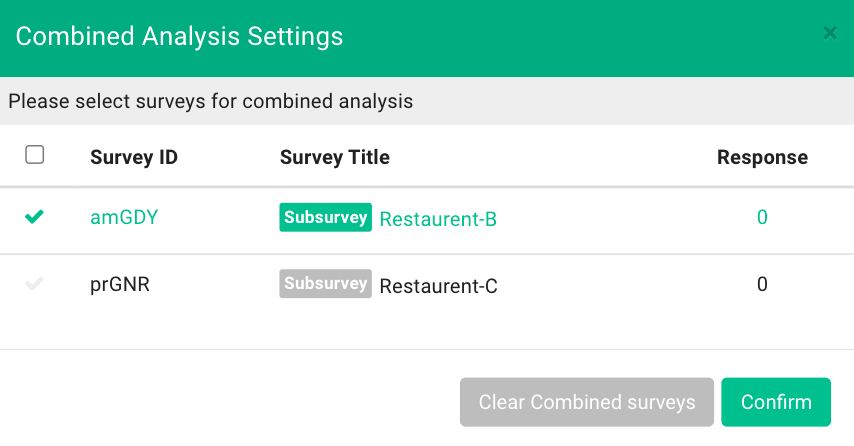
By using SurveyCake's "Subsurvey" function, You can simultaneously create multiple questionnaires of the same type. You can create multiple subsurvey from one "Parent survey" and allocate them to different targets. After that, the backend data system will perform combined analysis, which will greatly decrease the time spent on creating and managing surveys.
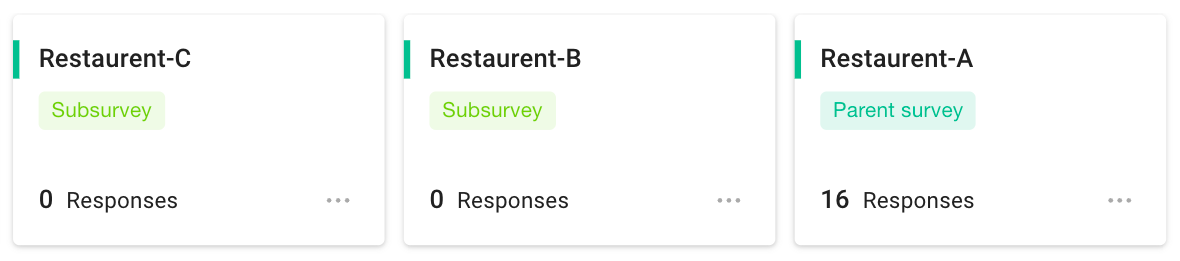
For example, a gym chain wants to use questionnaires to create reservation forms for each branch to control the flow of people. The store only needs to create one "Parent survey" and then use that to generate several subsurvey for different branches with a unified content. At the end, it can also conduct combined analysis on the responses from the different branches.
Each branch could conveniently control the number of people for different time slots, to easily manage the maximum number of people. So that the branch could notify the customers and send them to a different branch when it has reached the maximum number of people.
6. Label : Automatically classify data into different group
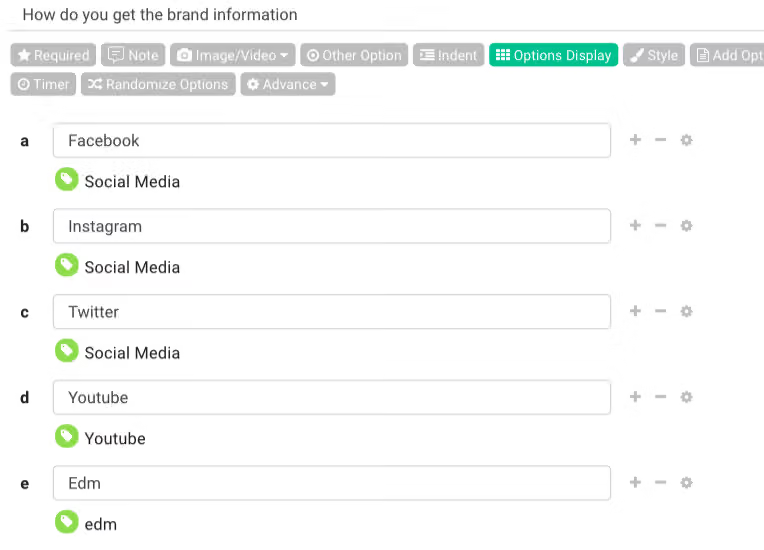
SurveyCake provides a "tag" function that automatically categorizes respondents who has chosen the "same attributes". It could effectively summarize the questionnaire data to help companies understand consumer profiles, allowing brands to make more accurate niche marketing or advertising strategies.
For example, during a market survey, you can set a "tag" on topics related to "get brand/ product information channel" to categorize marketing channels and gain insights into the preferences of various customer groups. These data can be further used to develop marketing strategies so that customers will receive the most appropriate marketing information.
7. Webhook : Create customized data applications
SurveyCake supports third-party services through Webhook link. Based on the answers collected in the questionnaire, you can develop APIs to trigger individual actions to facilitate subsequent marketing and customer relationship maintenance.
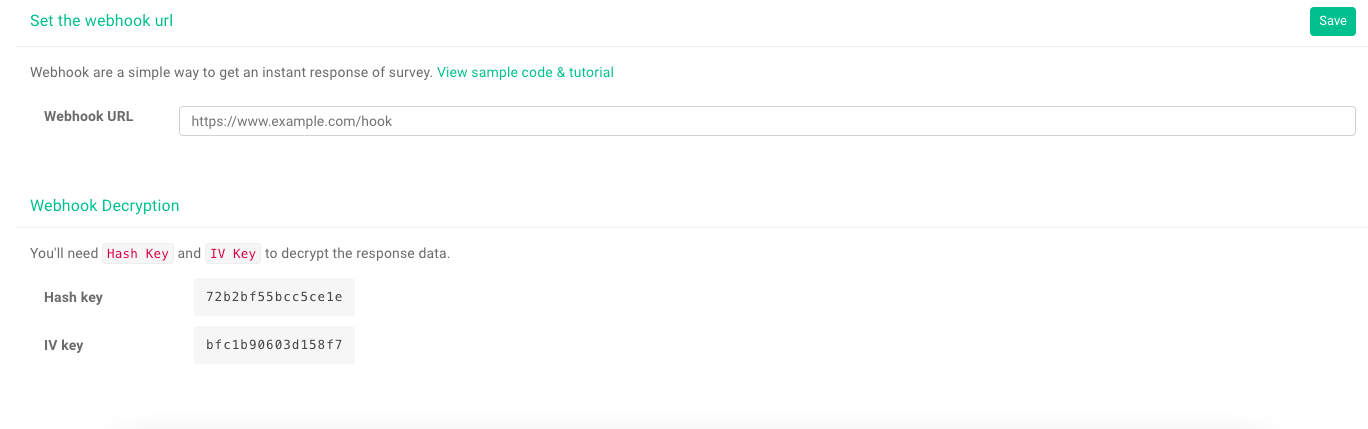
For example, the "tag" function can be used together with the Webhook function to perform third party link. When transferring data, the tags of each question will be imported into the databases, marking the answers of the same attribute. The company does not need to spend additional time on comparing data series but only needs to identify the corresponding tag behind each question.
8. GA4 & Meta Pixel: Respondent's Profile
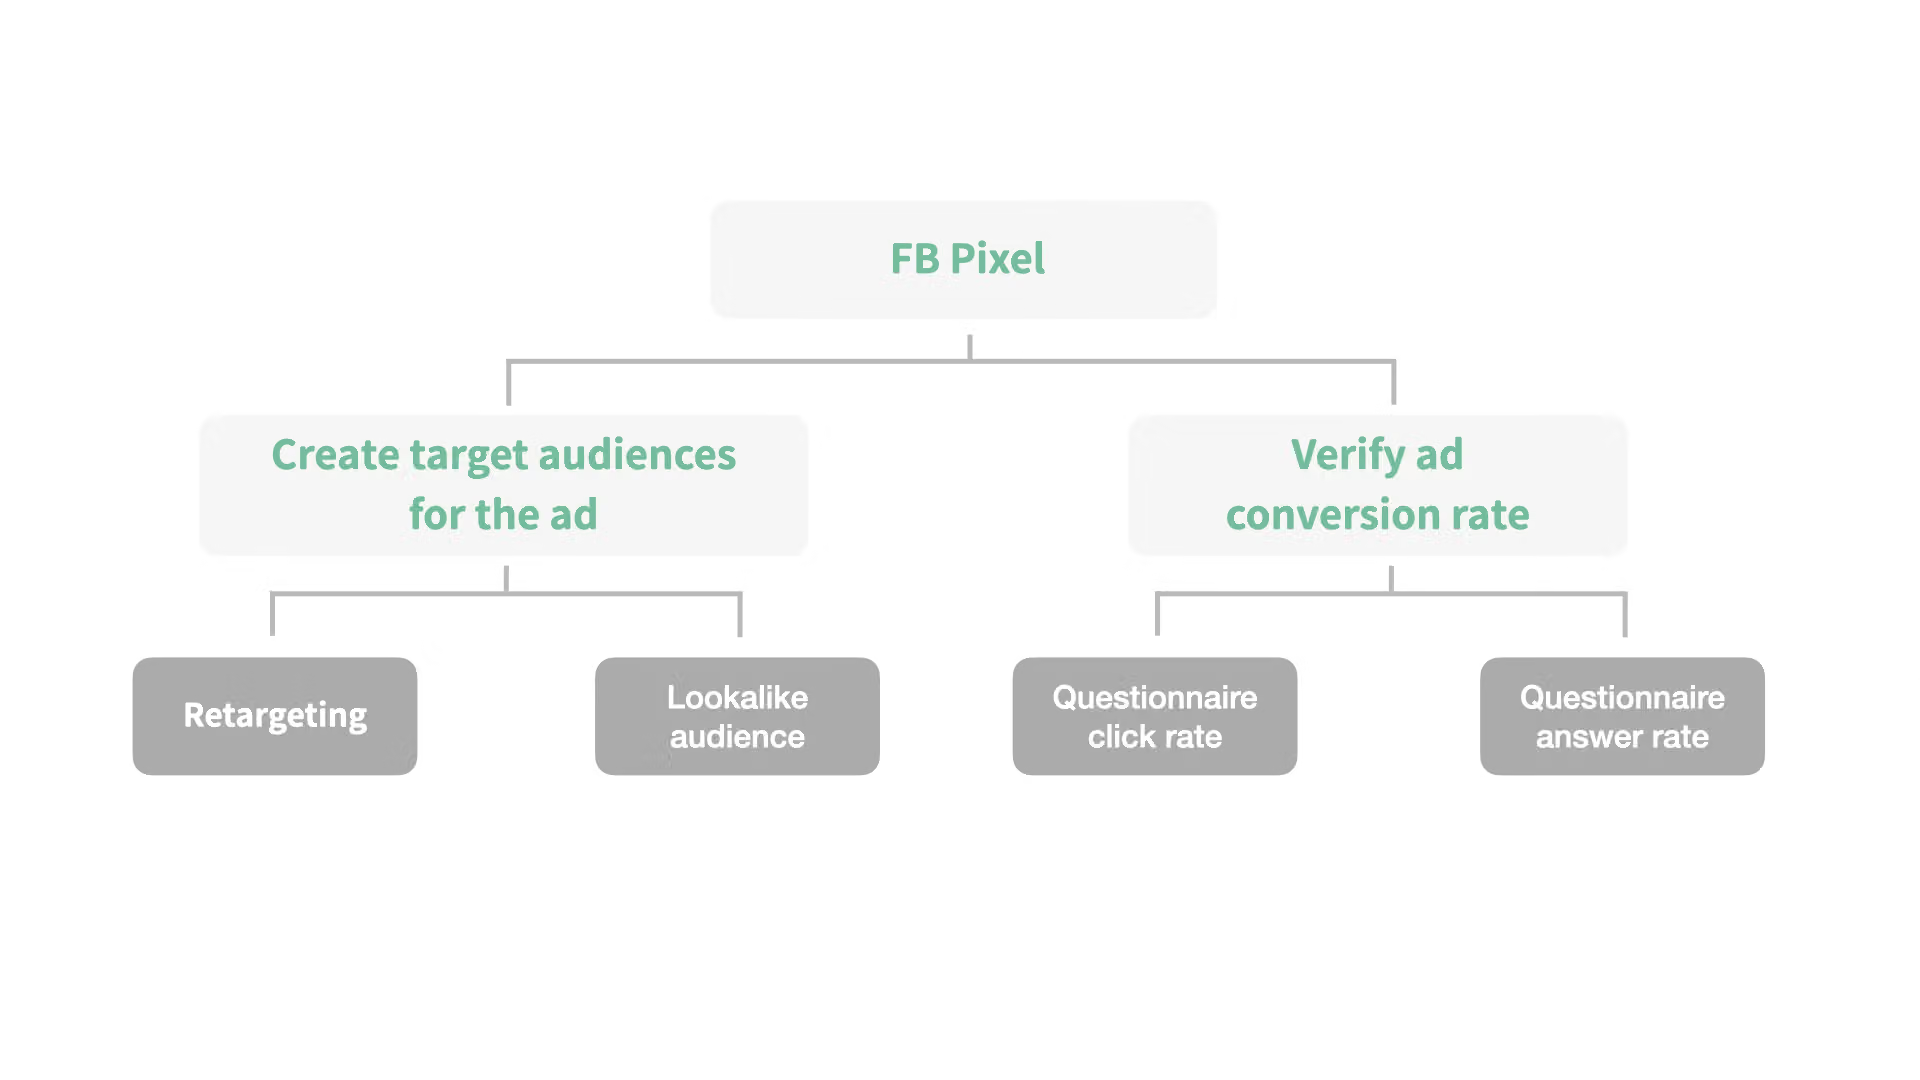
If you want to further analyze the respondents of the questionnaire, you can embed "GA4 Tracking Code" and "Meta Pixel" in the questionnaire to grasp their profiles, classify similar respondents, and create a re-targeting list. The company might have higher conversion rates when conducting brand advertising, EDM, or any re-targeting strategies in the future.
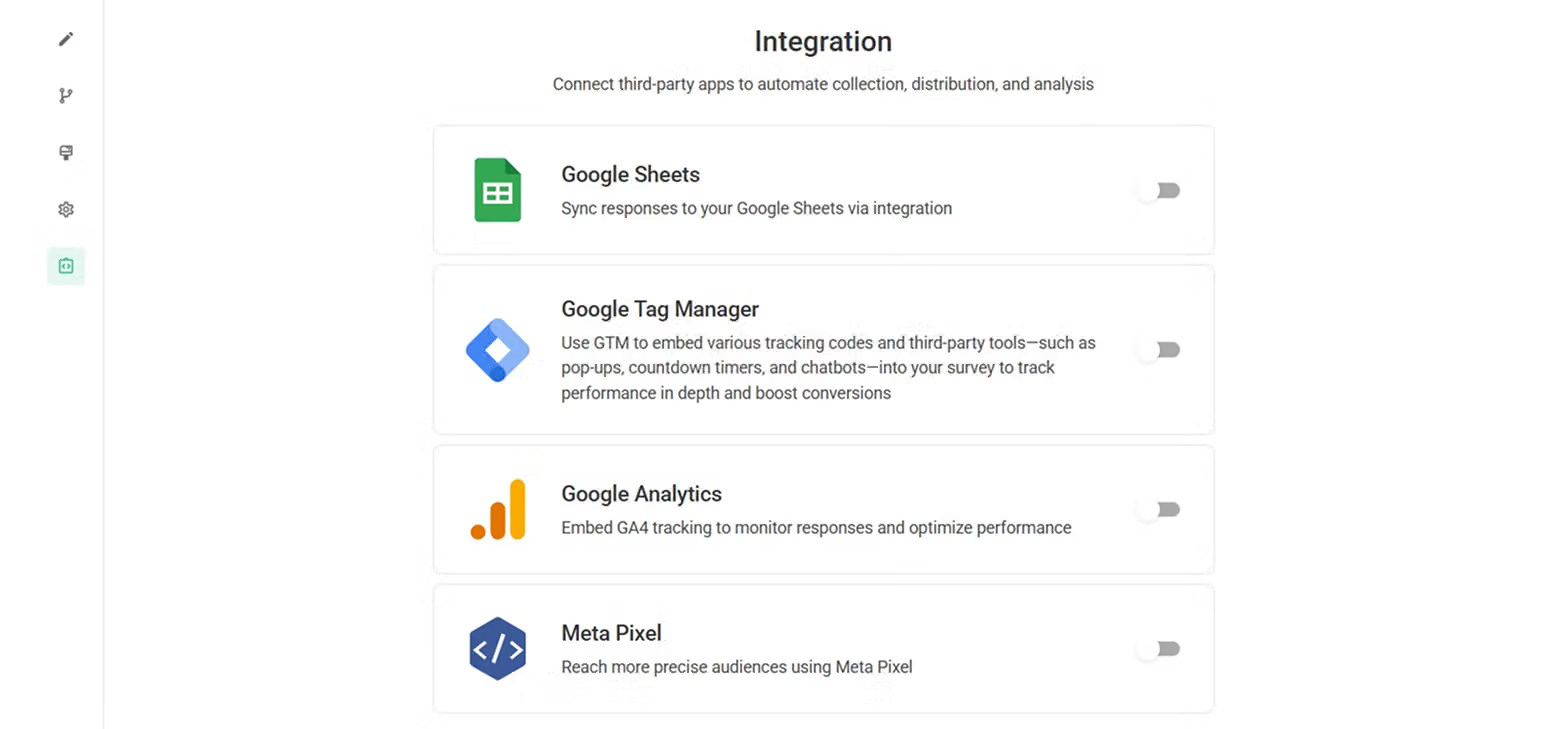
By using the questionnaire data collected by GA4, you could design a list of "target audiences" according to different variables (such as dwell time, specific browsing pages, demographics, etc.). You can then import the re-targeting list set by GA4 into the Google Ads account and use a more precise list for advertising. This way, you could target high interest users and increase the conversion rate.
Or you can create a retargeting list through Meta Pixel so that those who have filled the questionnaire will have the potential to be attracted by the ad and come back to buy the product. You can also create lookalike audience, develop new customer groups and potential respondents to achieve maximal exposure.
Make good use of SurveyCake Analytics to create greater value for each response!