In the past, satisfaction-related questions have mostly been answered using numerical ratings. While Rating not only help you to quantify satisfaction, but also using visual elements / symbols instead of just numbers which make the survey more engaging. In addition to other commonly available functions like Required, Note, Add Media, Indent, Style, Hide, and Timer. We can get an even more precise feedback format to suit our needs by using Rating Options to set ranges between ratings.
For example: You would like to get the satisfactory feedback from participants after a given event
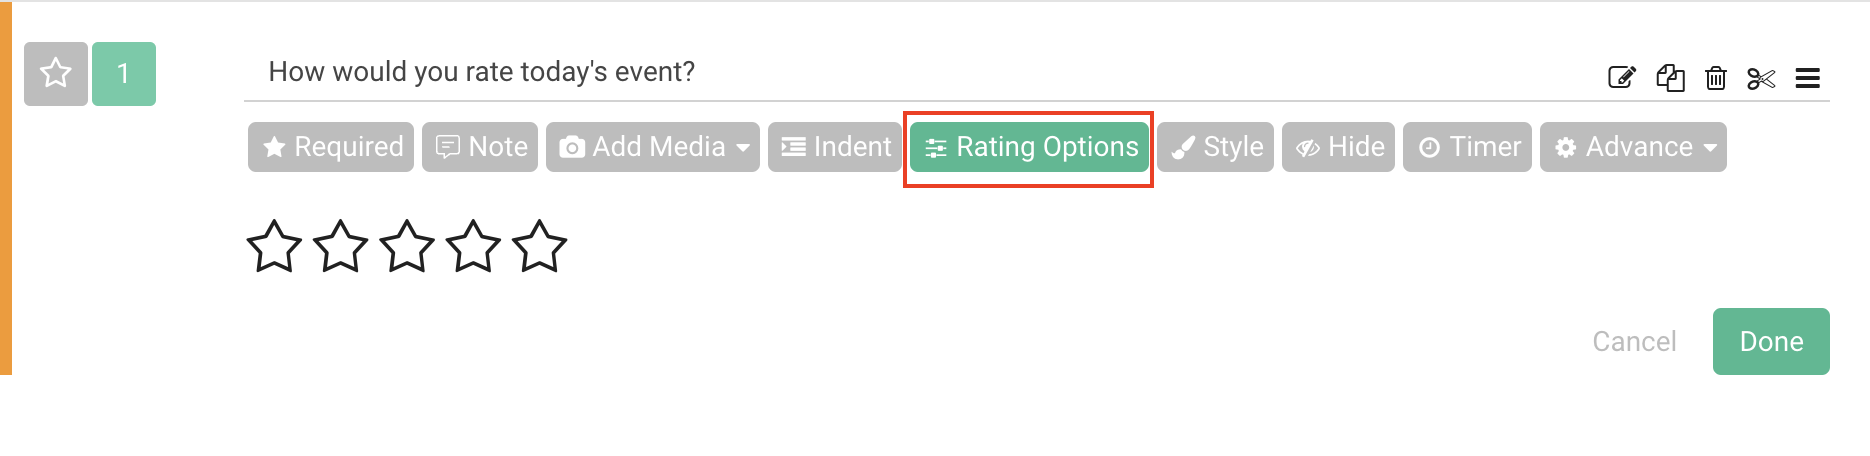
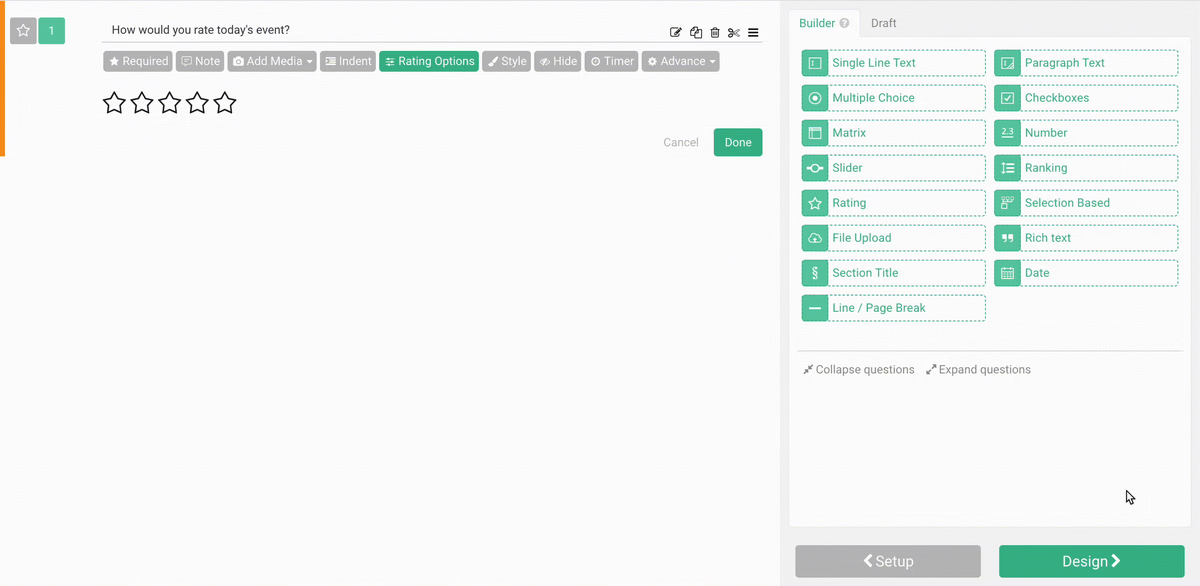
If 5 stars are not enough to gauge accurately, or you would like to use something else instead of a star,you can use Rating Options to custom set rating ranges or change the icons used to rate to make the questions fit your needs better.
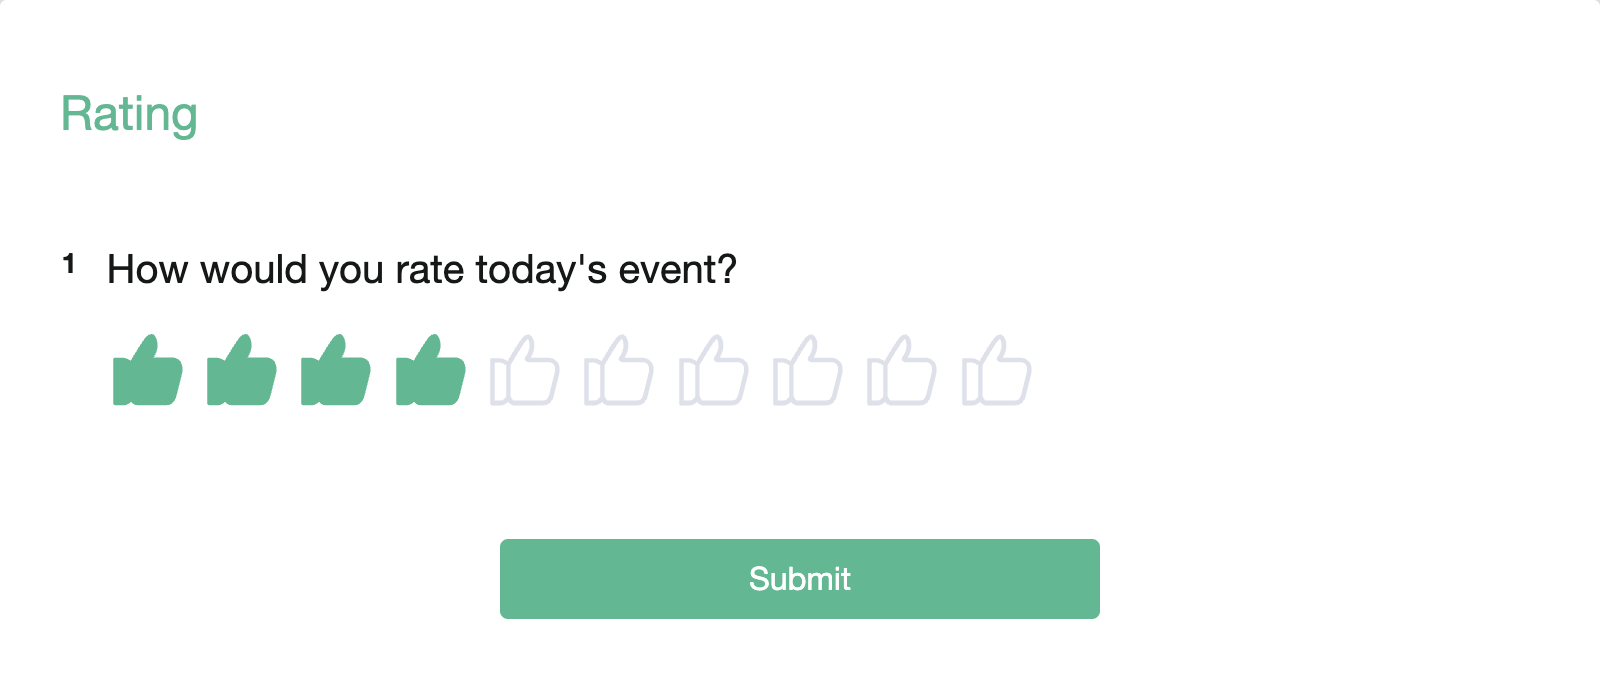
For example: You want the rating scale to be 1 - 10 with “Thumbs up” symbols.
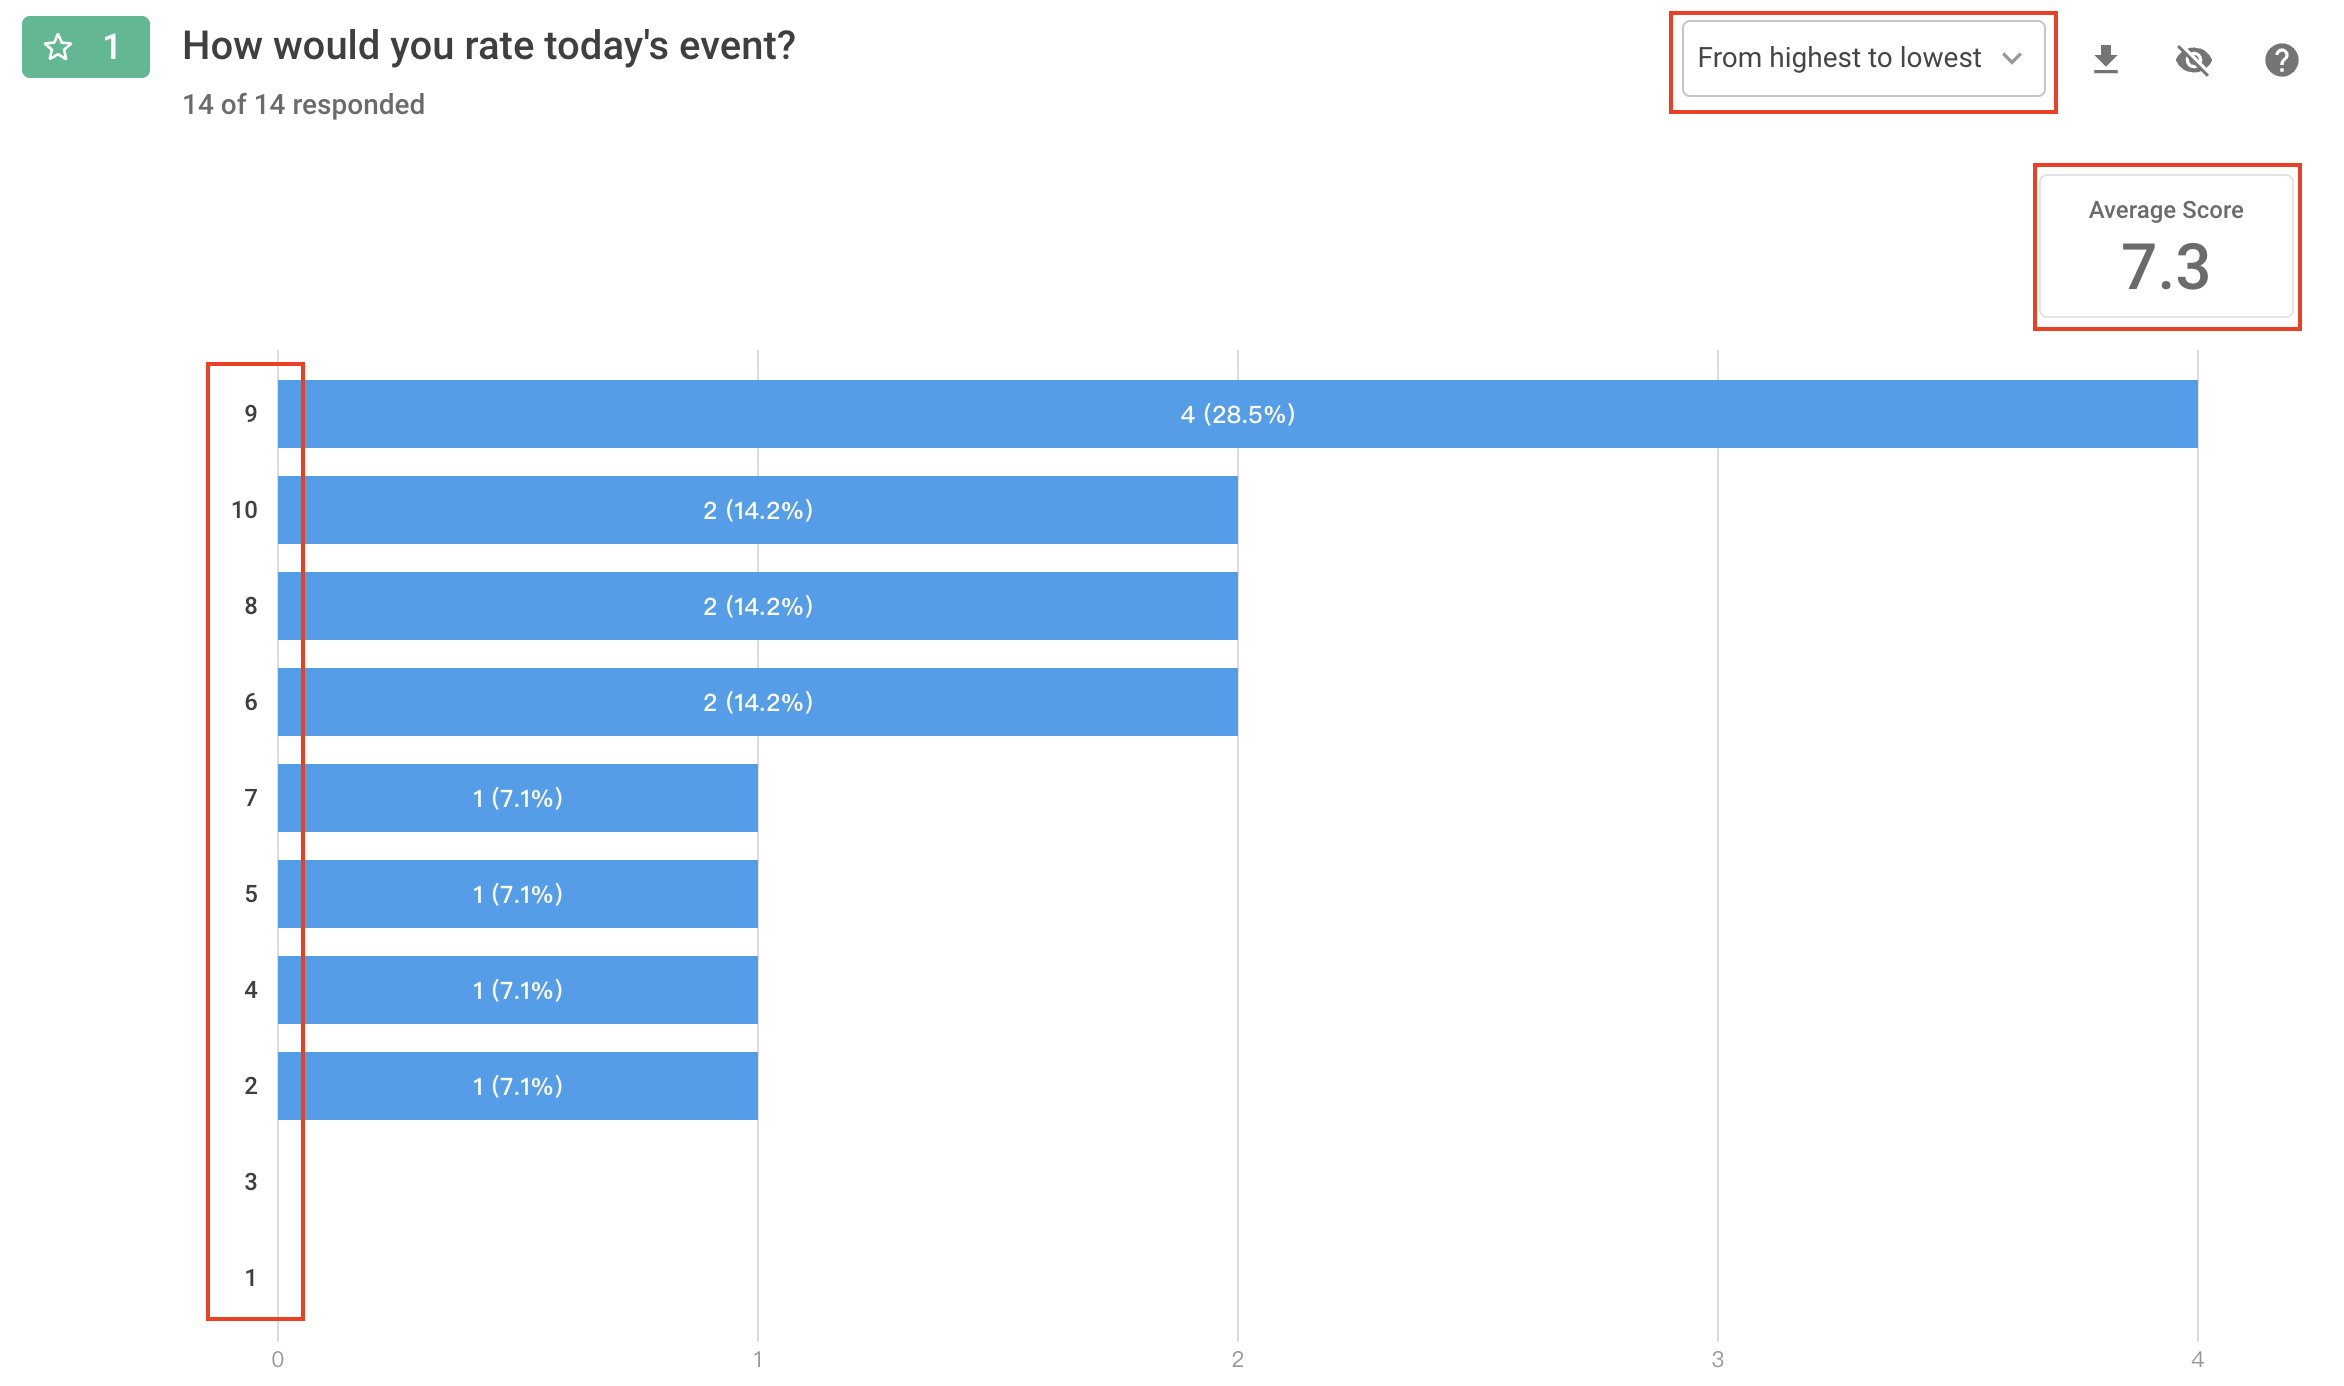
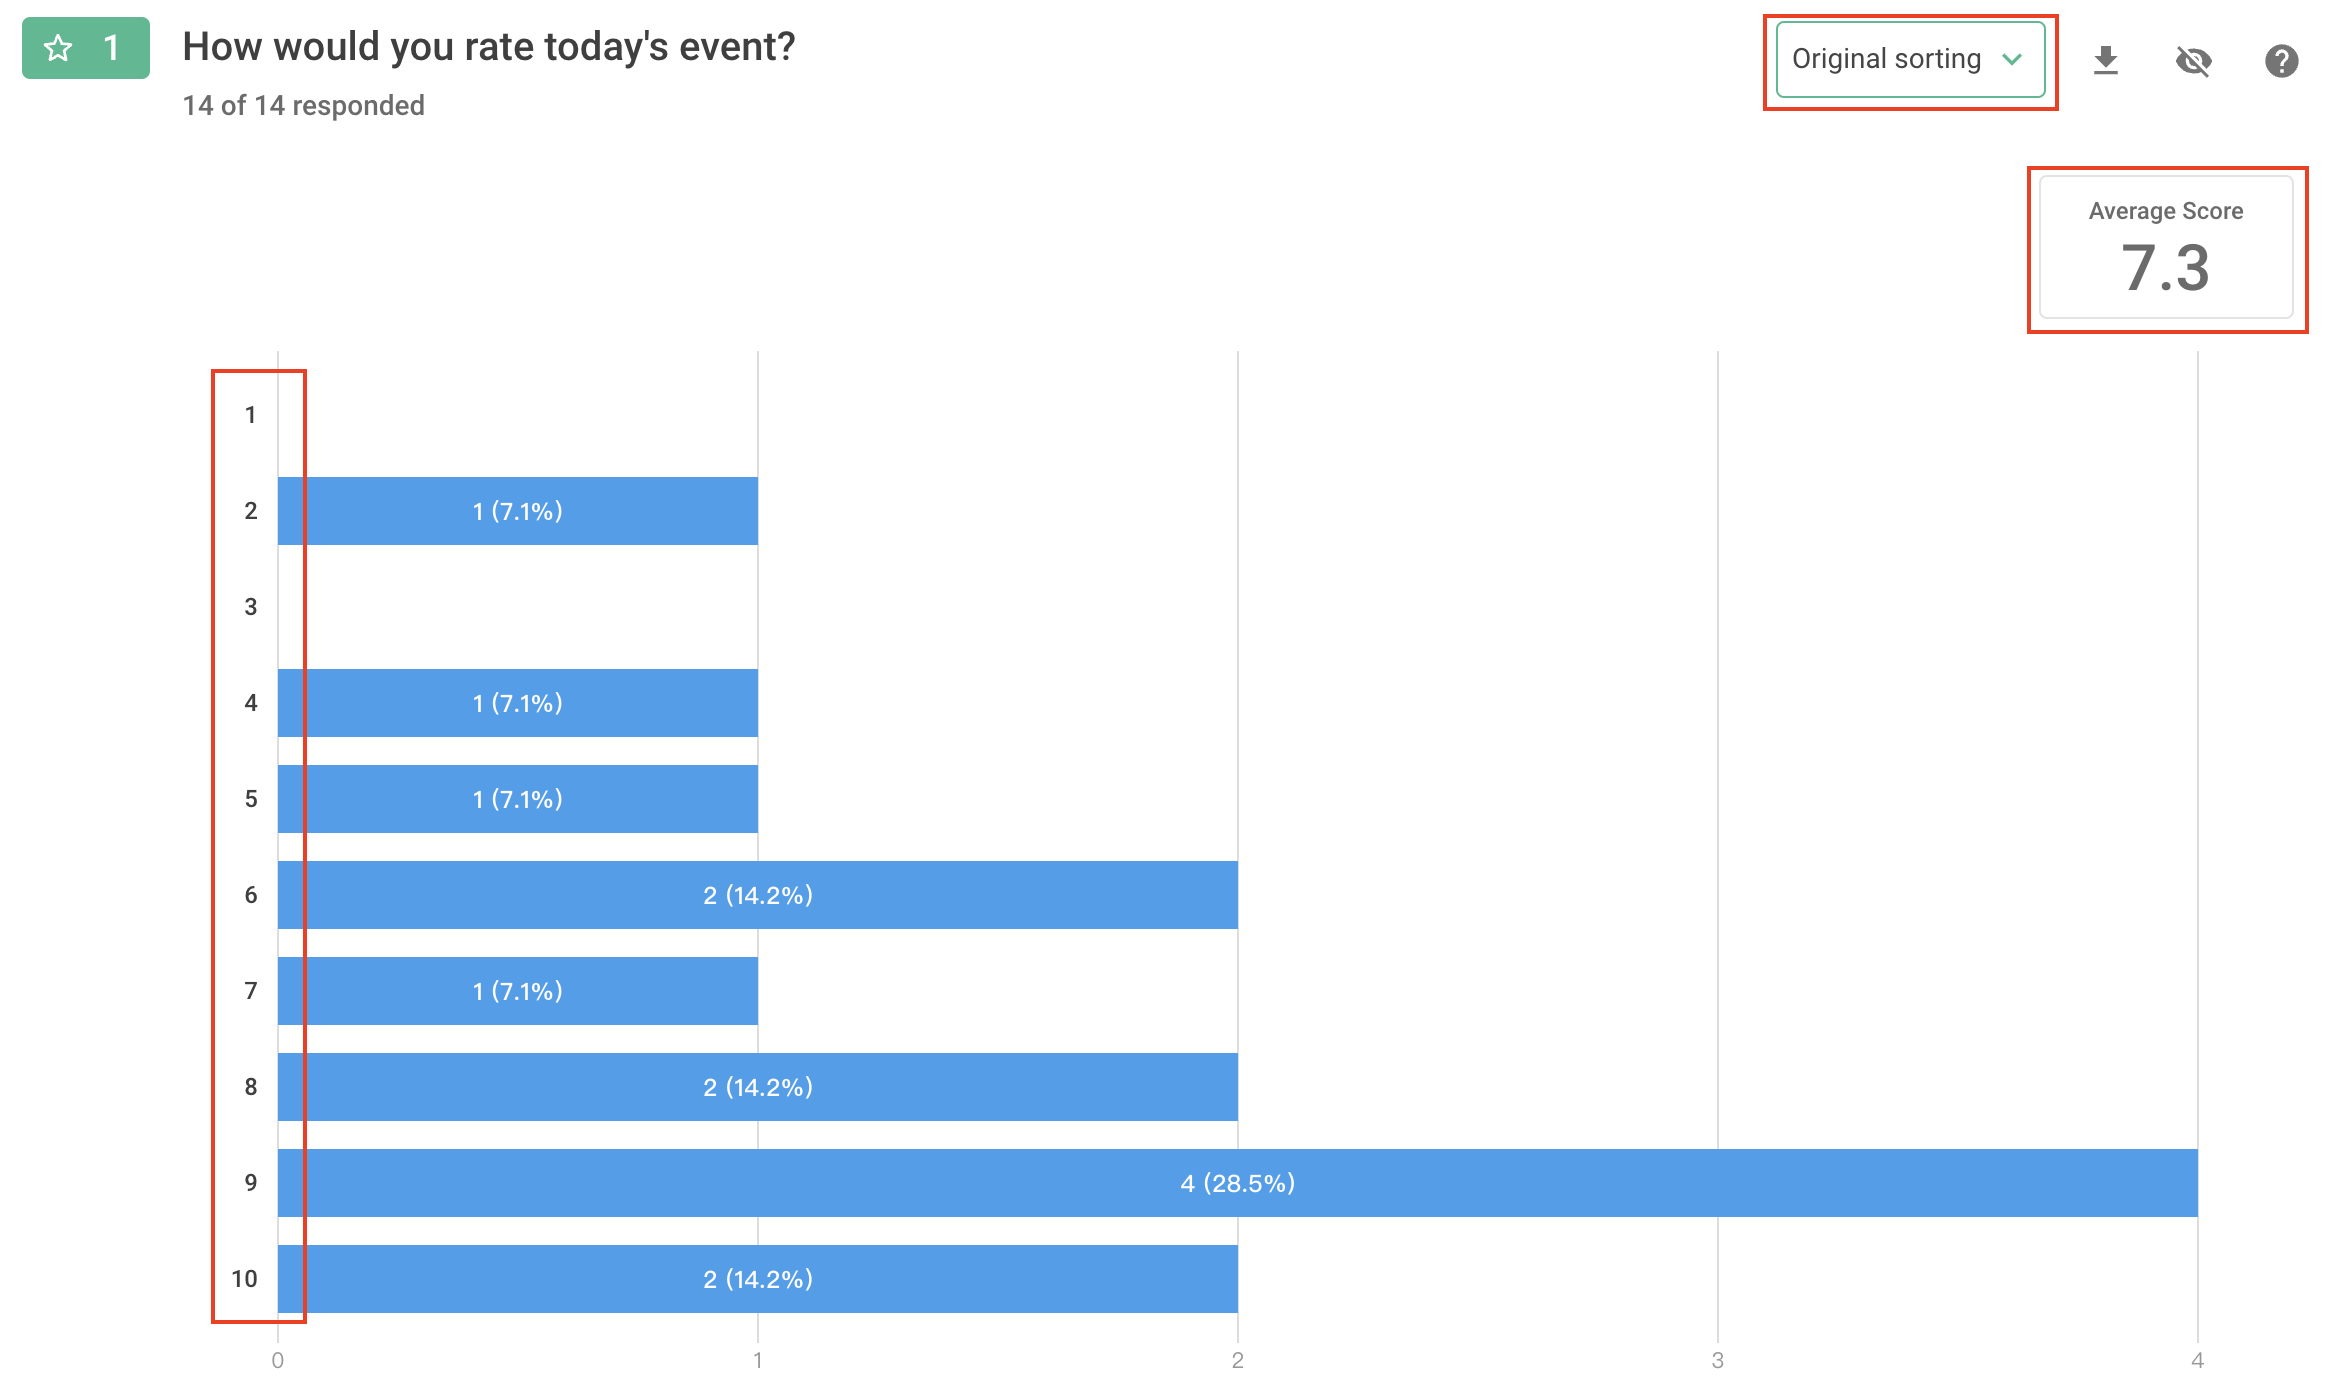
After respondents submitted their responses, you can see a horizontal bar chart showing the frequency of each star rating in Chart Report. The average star rating is also shown in the top right corner. Additionally, you can choose the bar chart display order between “From Highest to Lowest” or “Original Sorting”:
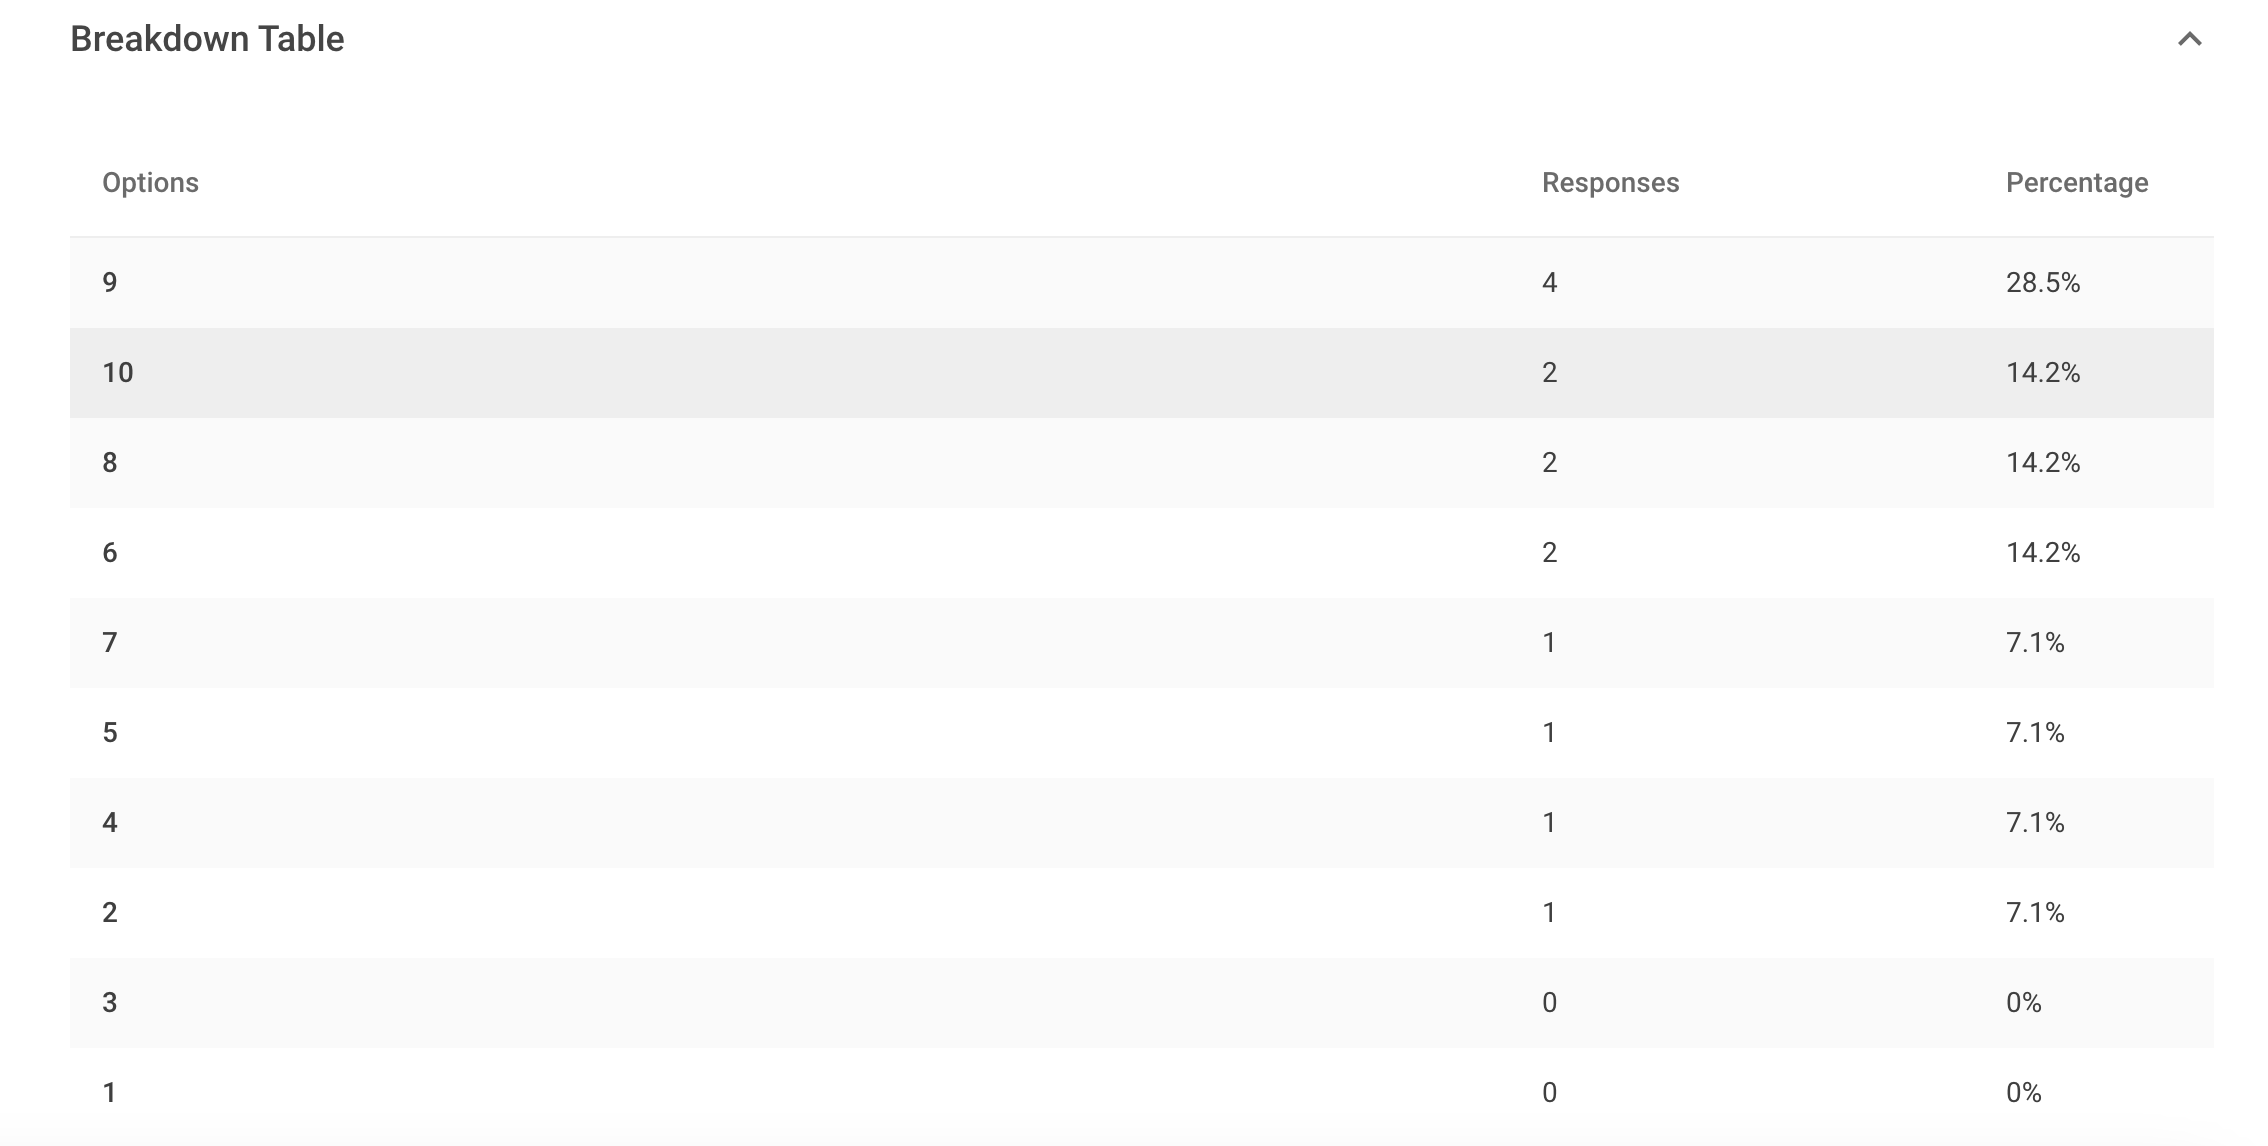
Lastly, there will be Breakdown Table that allows you to see various calculation results for the response data.
FAQs
First of all, Rating and Slider are commonly used in various satisfaction surveys, mainly to make it easier for respondents to rate.
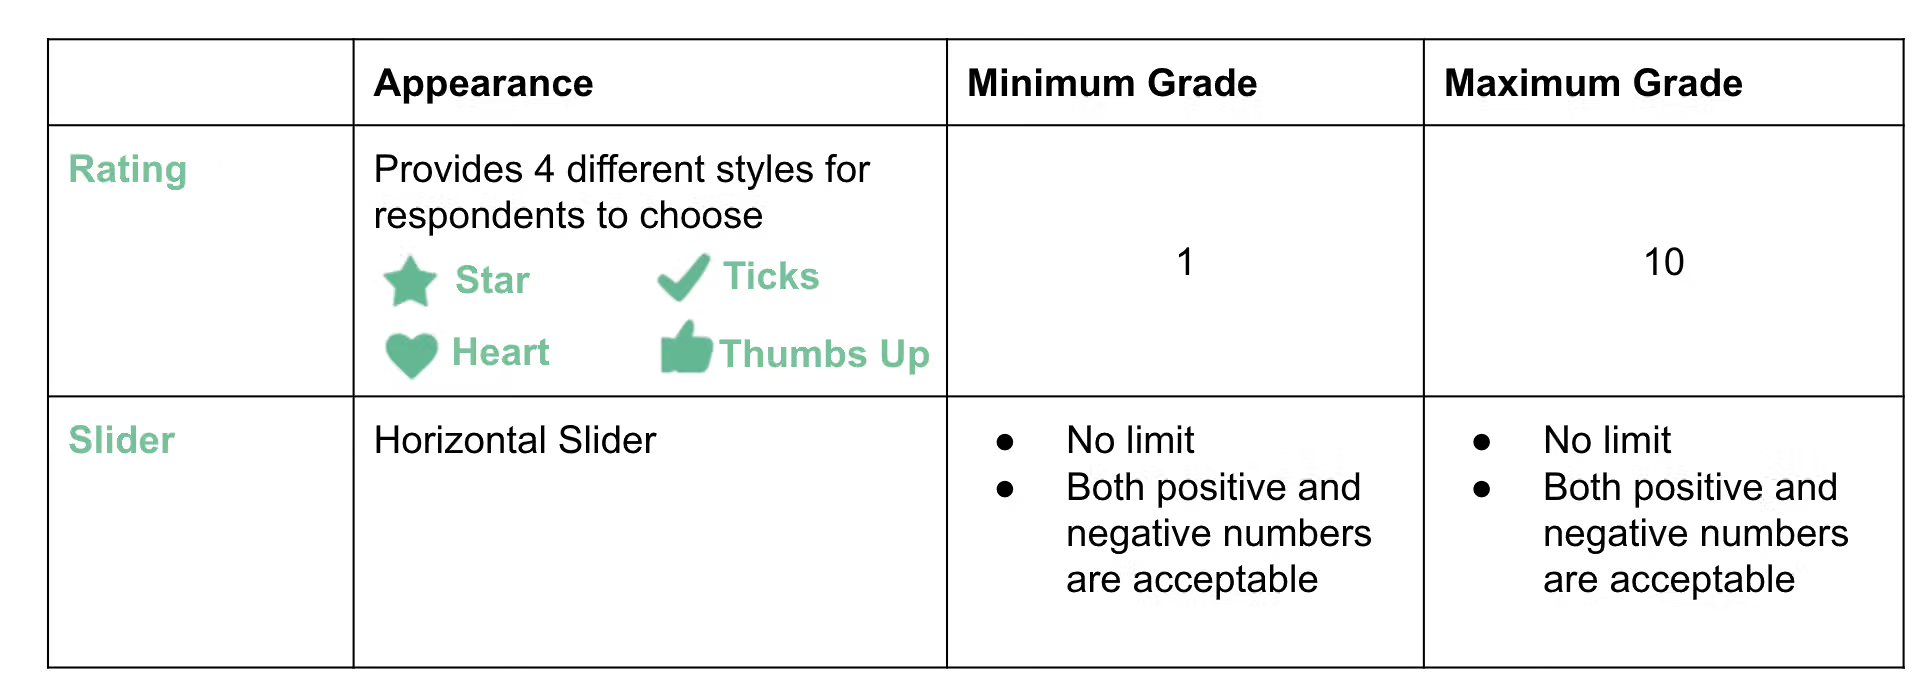
The main difference between these two types of functions lies in the way they are presented and the experience they provide to the respondents.
Here is a table to illustrate the differences between the two functions :
Through iconized Rating question type, respondents can give a rating with stars or any other graphics! Don't forget these tips the next time you design a survey!