In addition to Chart Report, collecting respondent details is an integral part of survey analysis. With Data Report in SurveyCake, it is possible to view or delete data, designate filter, sorting info and convert info for easy browsing. Excel and SPSS files can also be downloaded for further analysis or data storage!
All responses can be found and reviewed using Data Report, accessible via survey backstage.
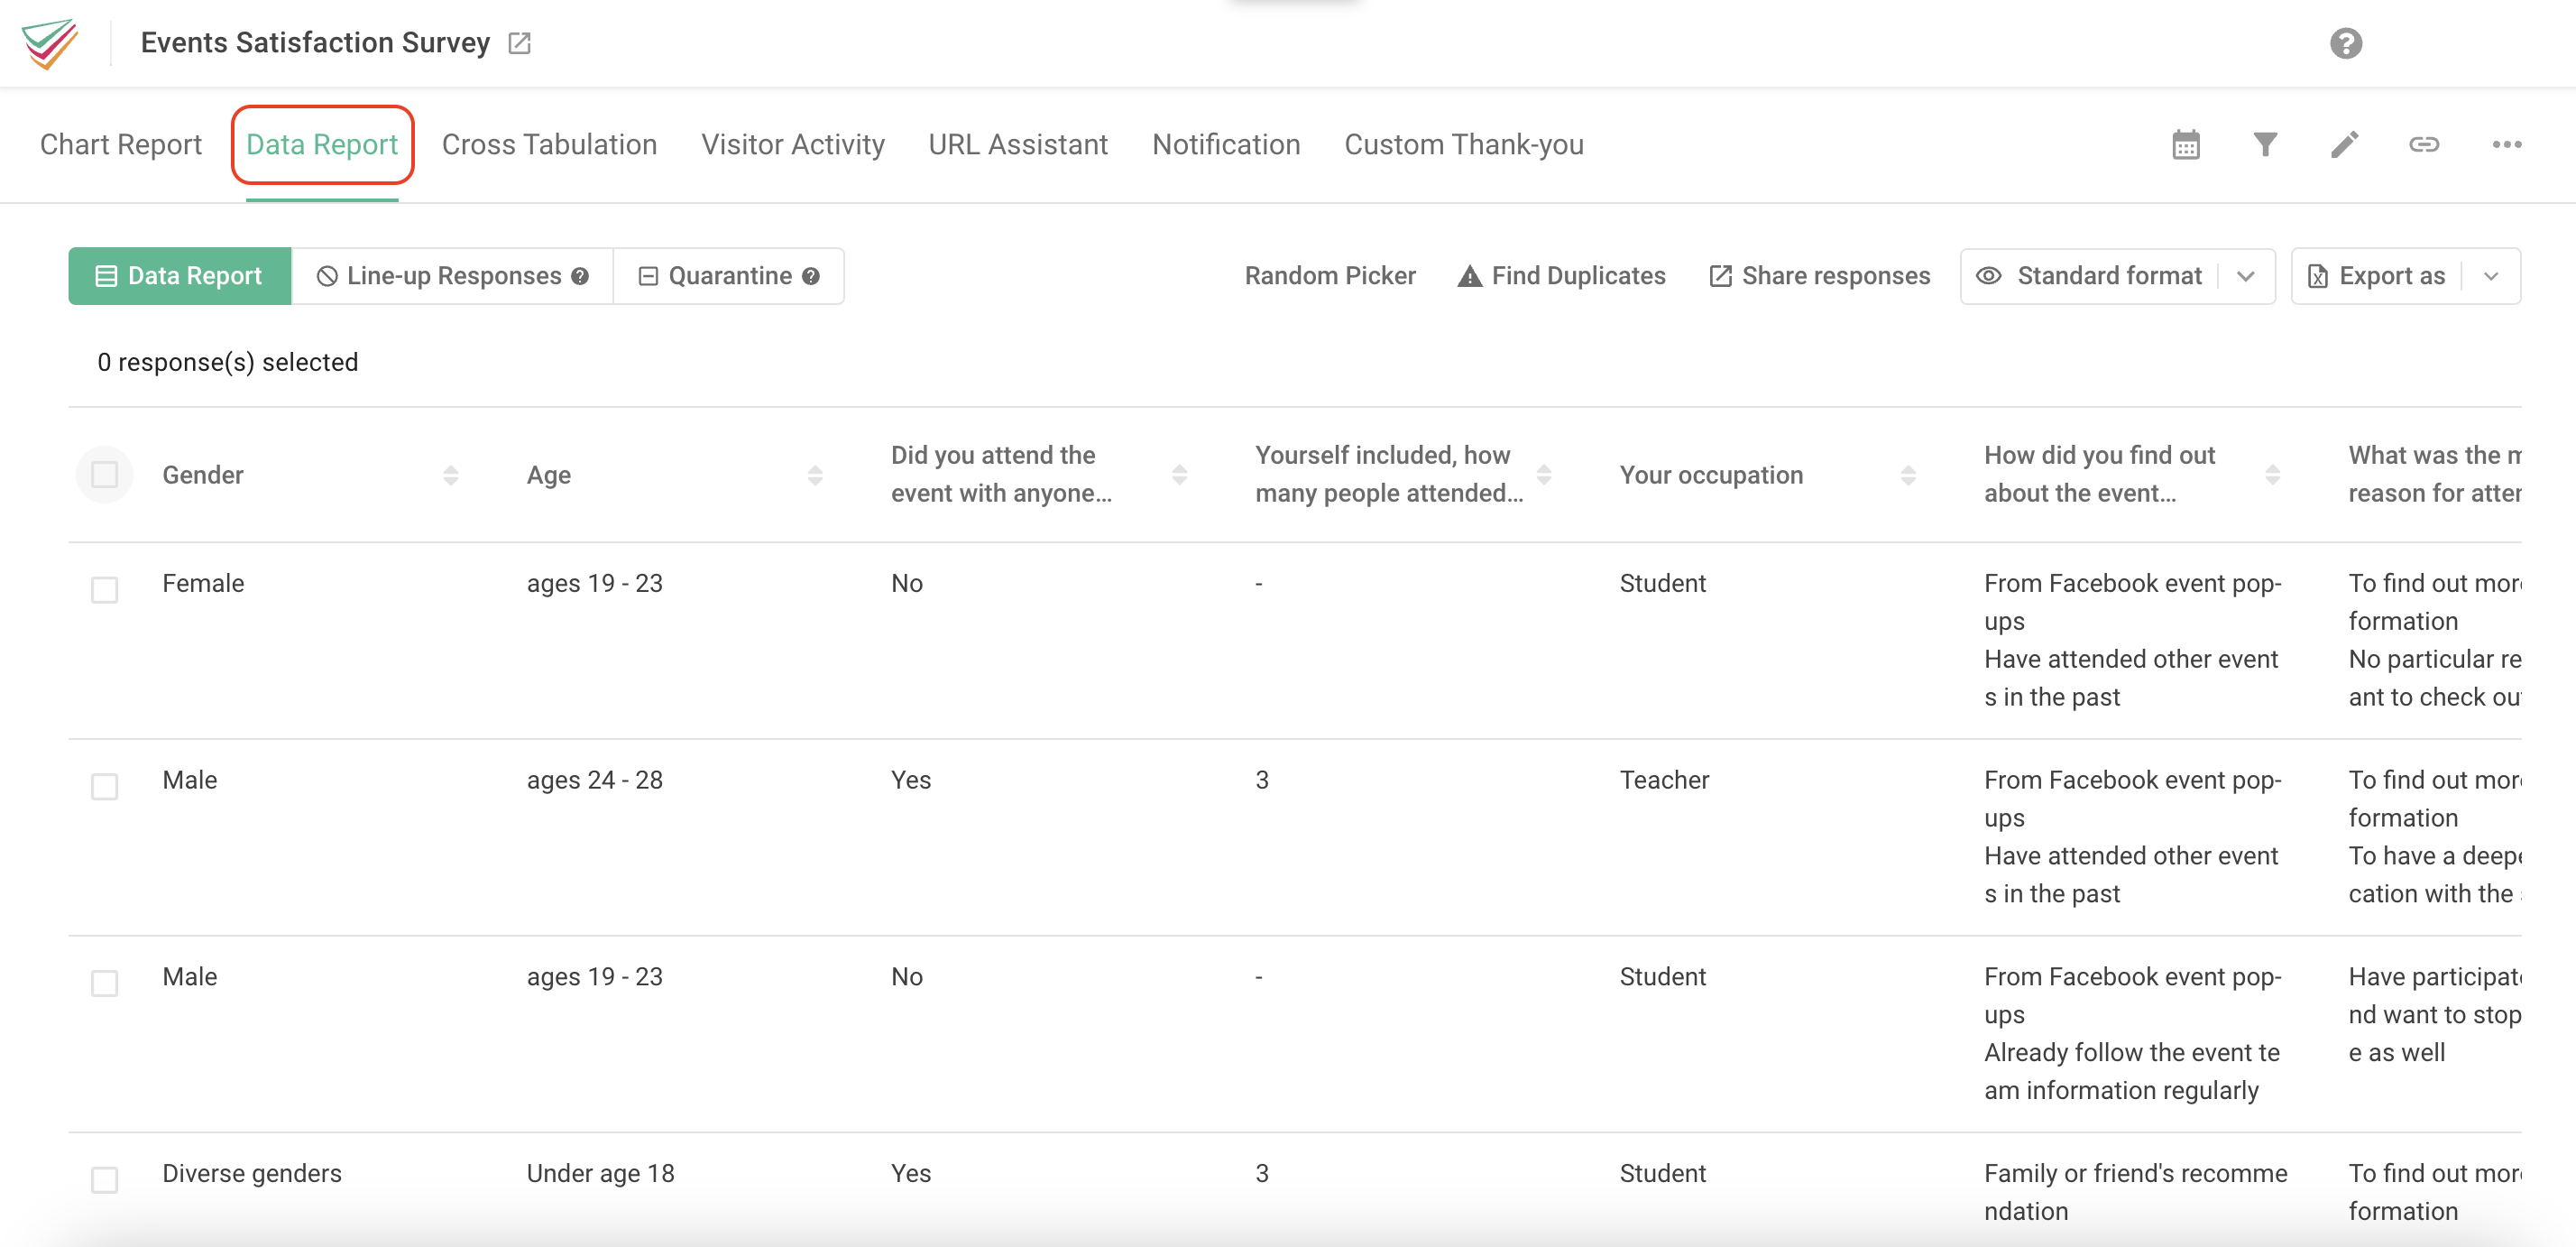
Here are the explanation of the commonly used features in Data Report:
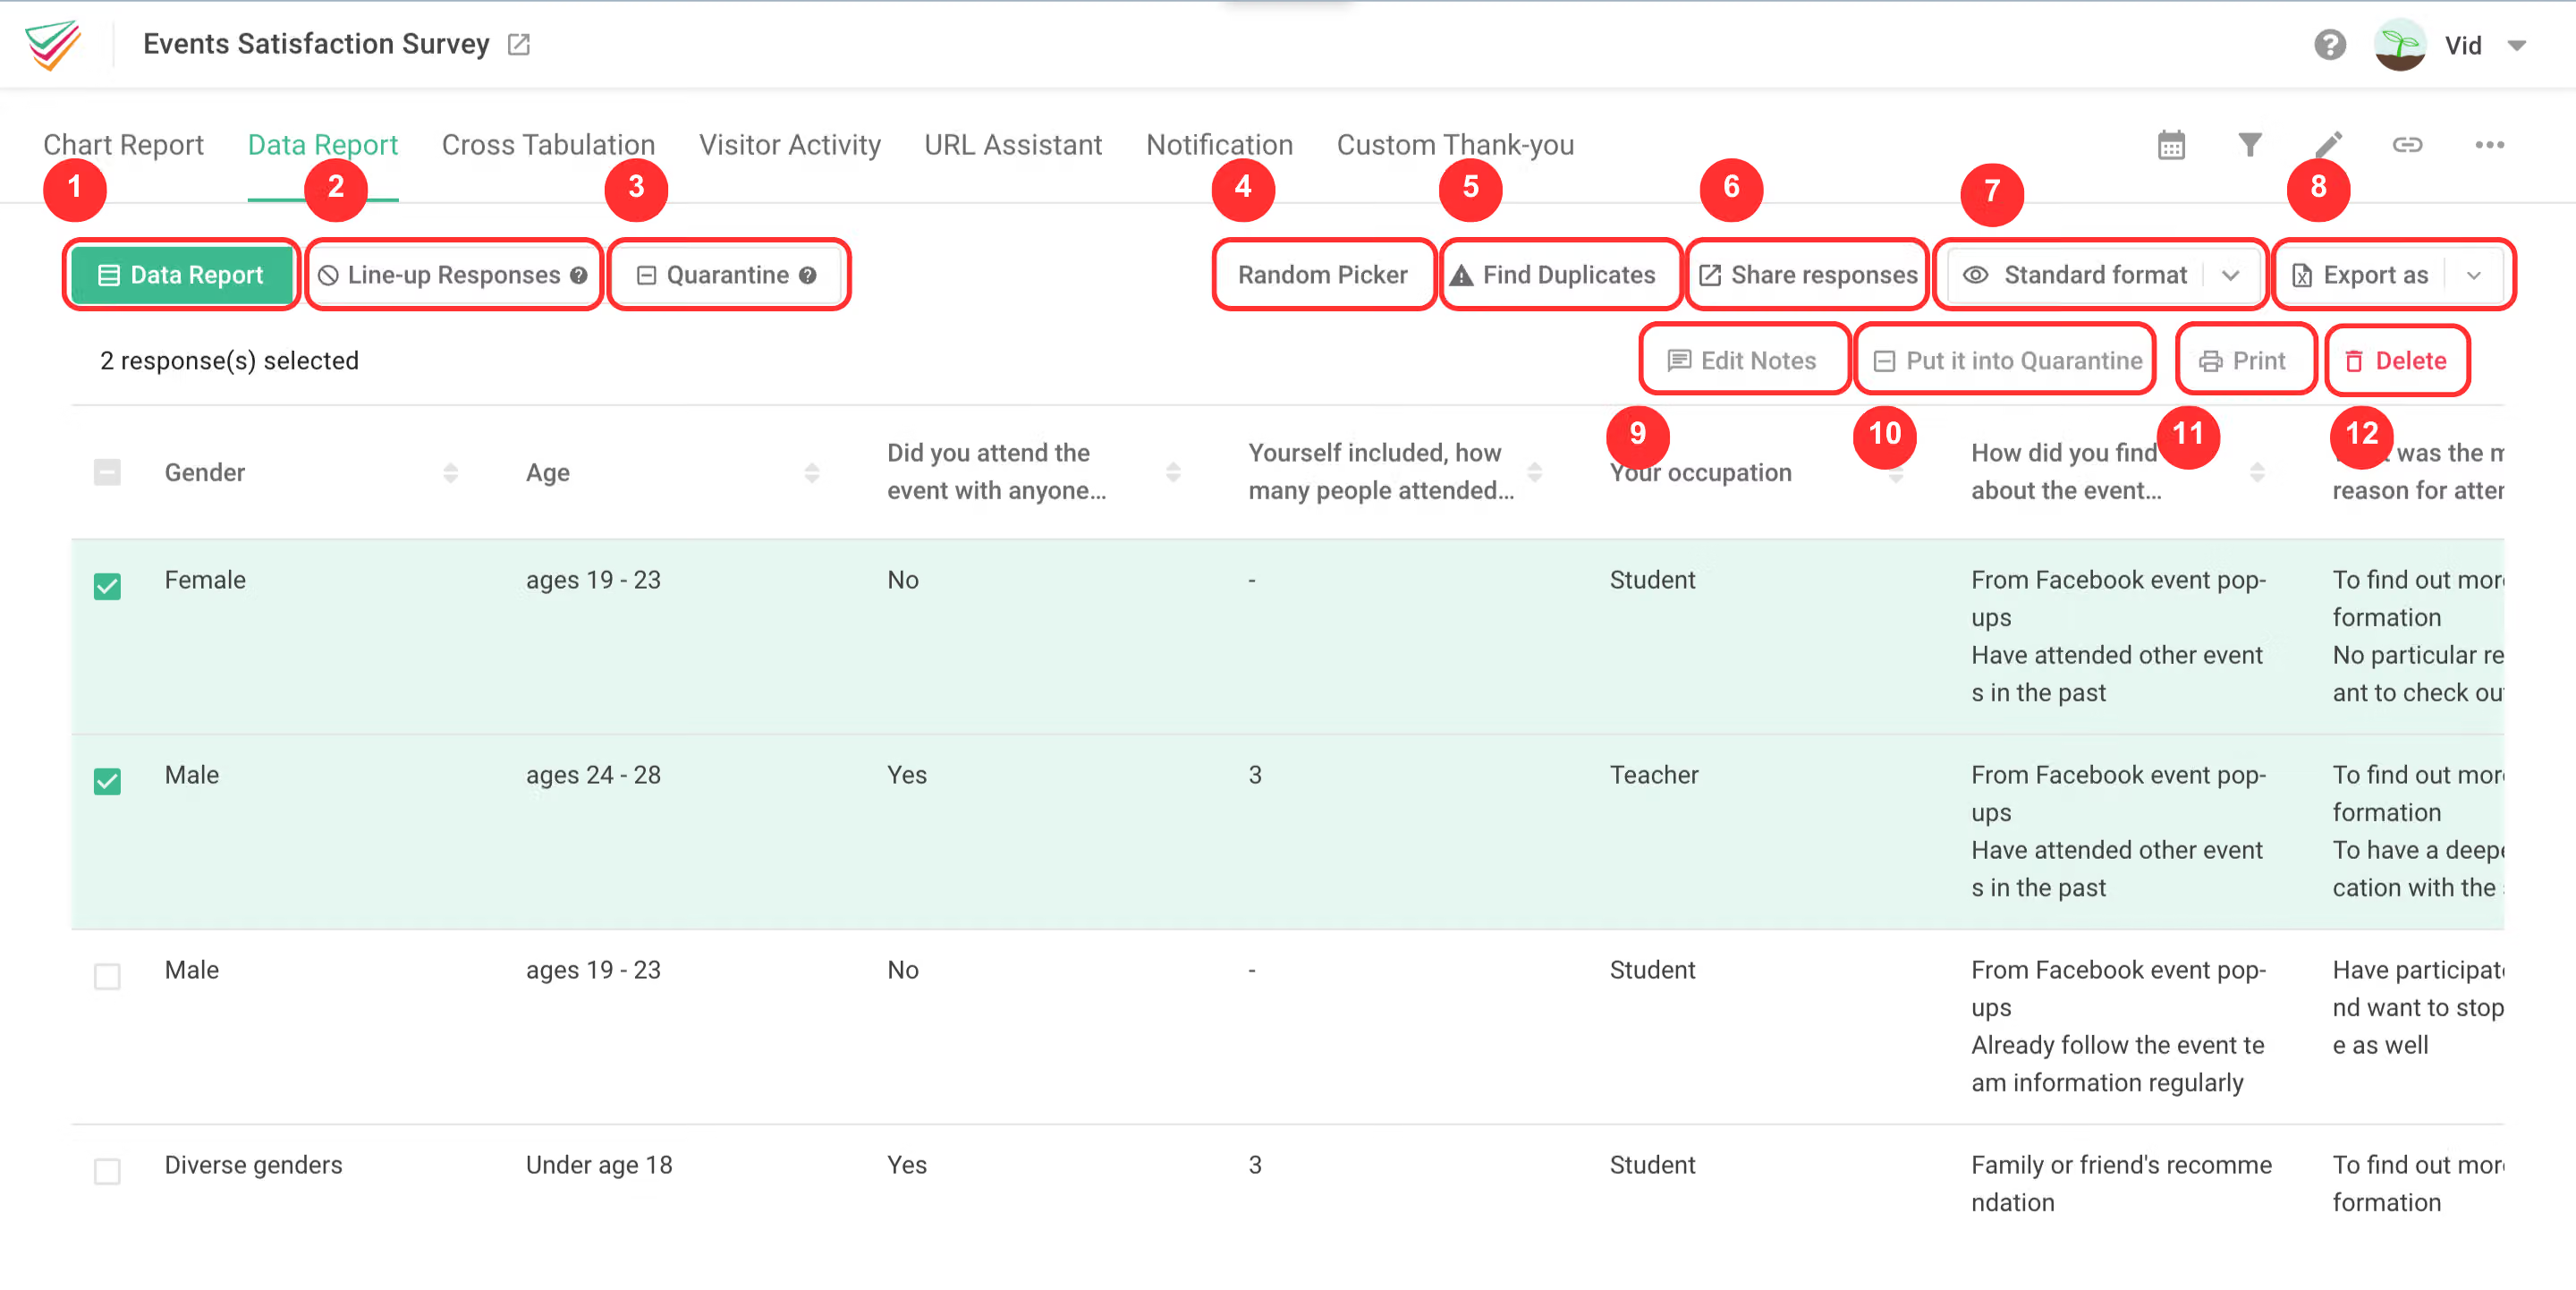
1. Data Report
You can view the complete details of your survey responses here!
When there is a sudden surge in usage of SurveyCake services, the system will automatically activate a response queuing protection mechanism. This will temporarily place responses in the Line-Up Responses to prevent server disconnection due to a sudden high traffic.
3. Quarantine
If you've enabled features such as Isolate By Response Time, Isolate Duplicates, or reCAPTCHA, responses identified as invalid by the system are placed in the Quarantine area, which helps you to separate them from valid responses.
You can conduct prize or lottery draws for your surveys without exporting your data. Simply use SurveyCake's built-in feature, Random Picker, to select random responses and directly pick the lucky winners from all of your survey responses!
5. Find Duplicates
Use the Find Duplicates feature to identify and compare duplicate response data, such as duplicate names, IP records, or email addresses.
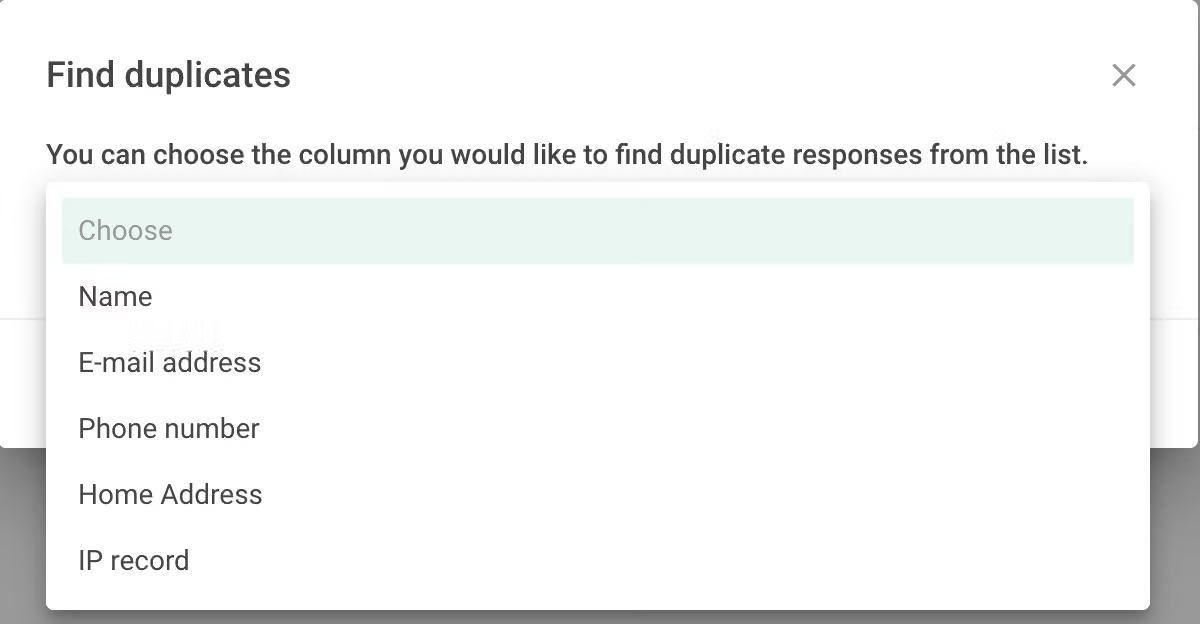
In addition to the Find duplicates, you can also use Date Filter and Filter to view specific response.
Allows you to quickly share the survey response with others.
7. Data Format
You can choose to display your data in three different formats: "Standard Format", "SPSS Format," or "Original Format."
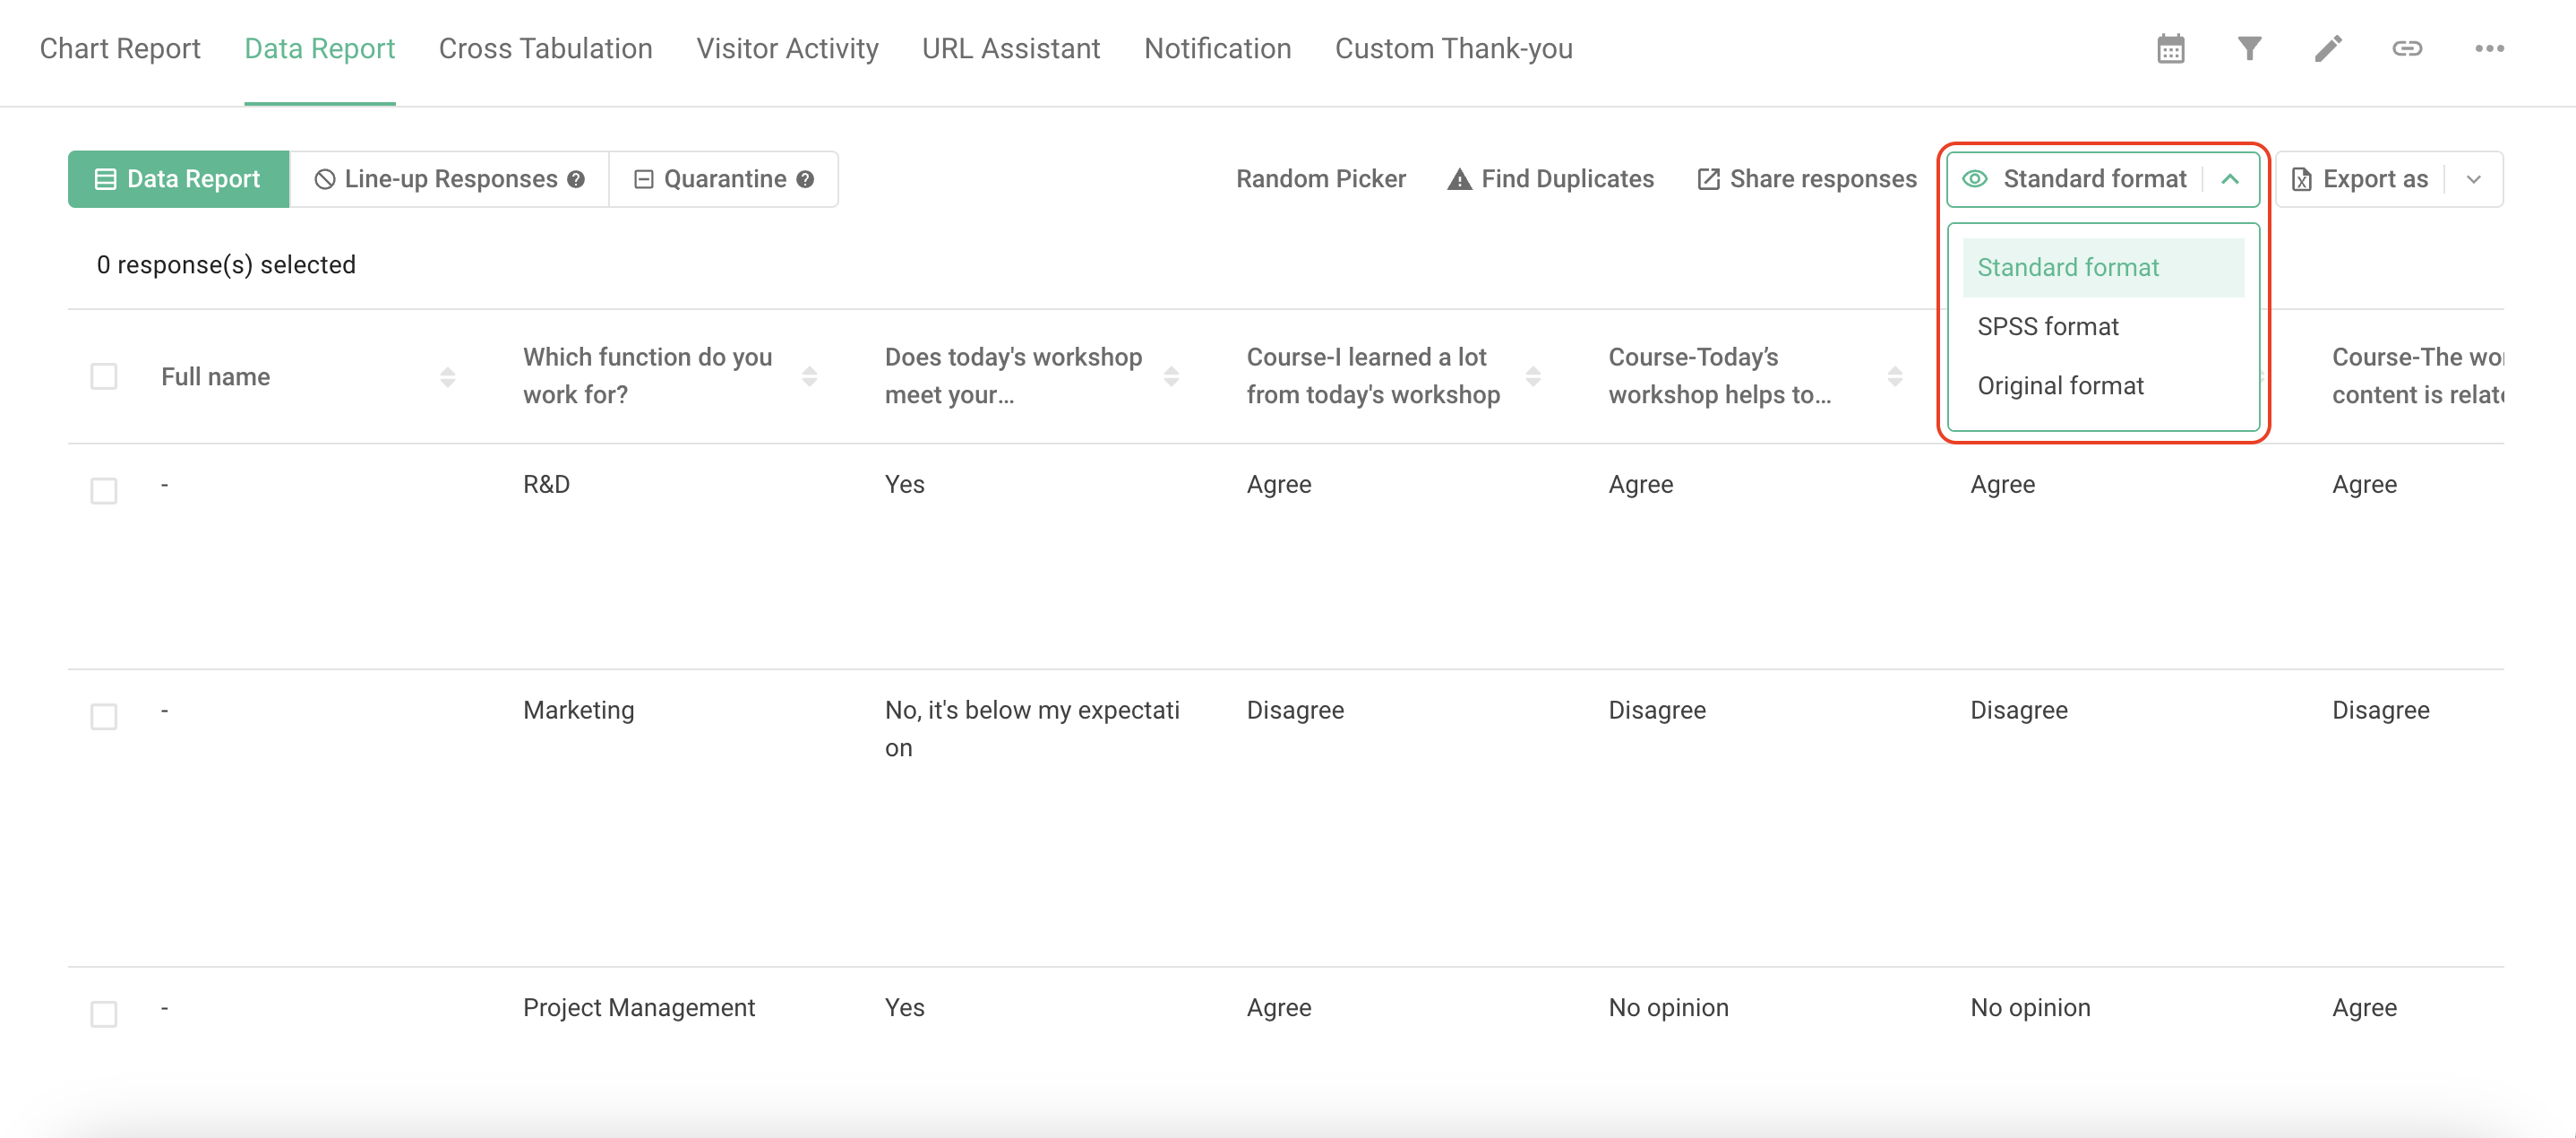
Using the default system format, data is automatically converted into the most intuitive format, presenting each complete answer directly within its corresponding question field. This allows you to quickly review every data result.
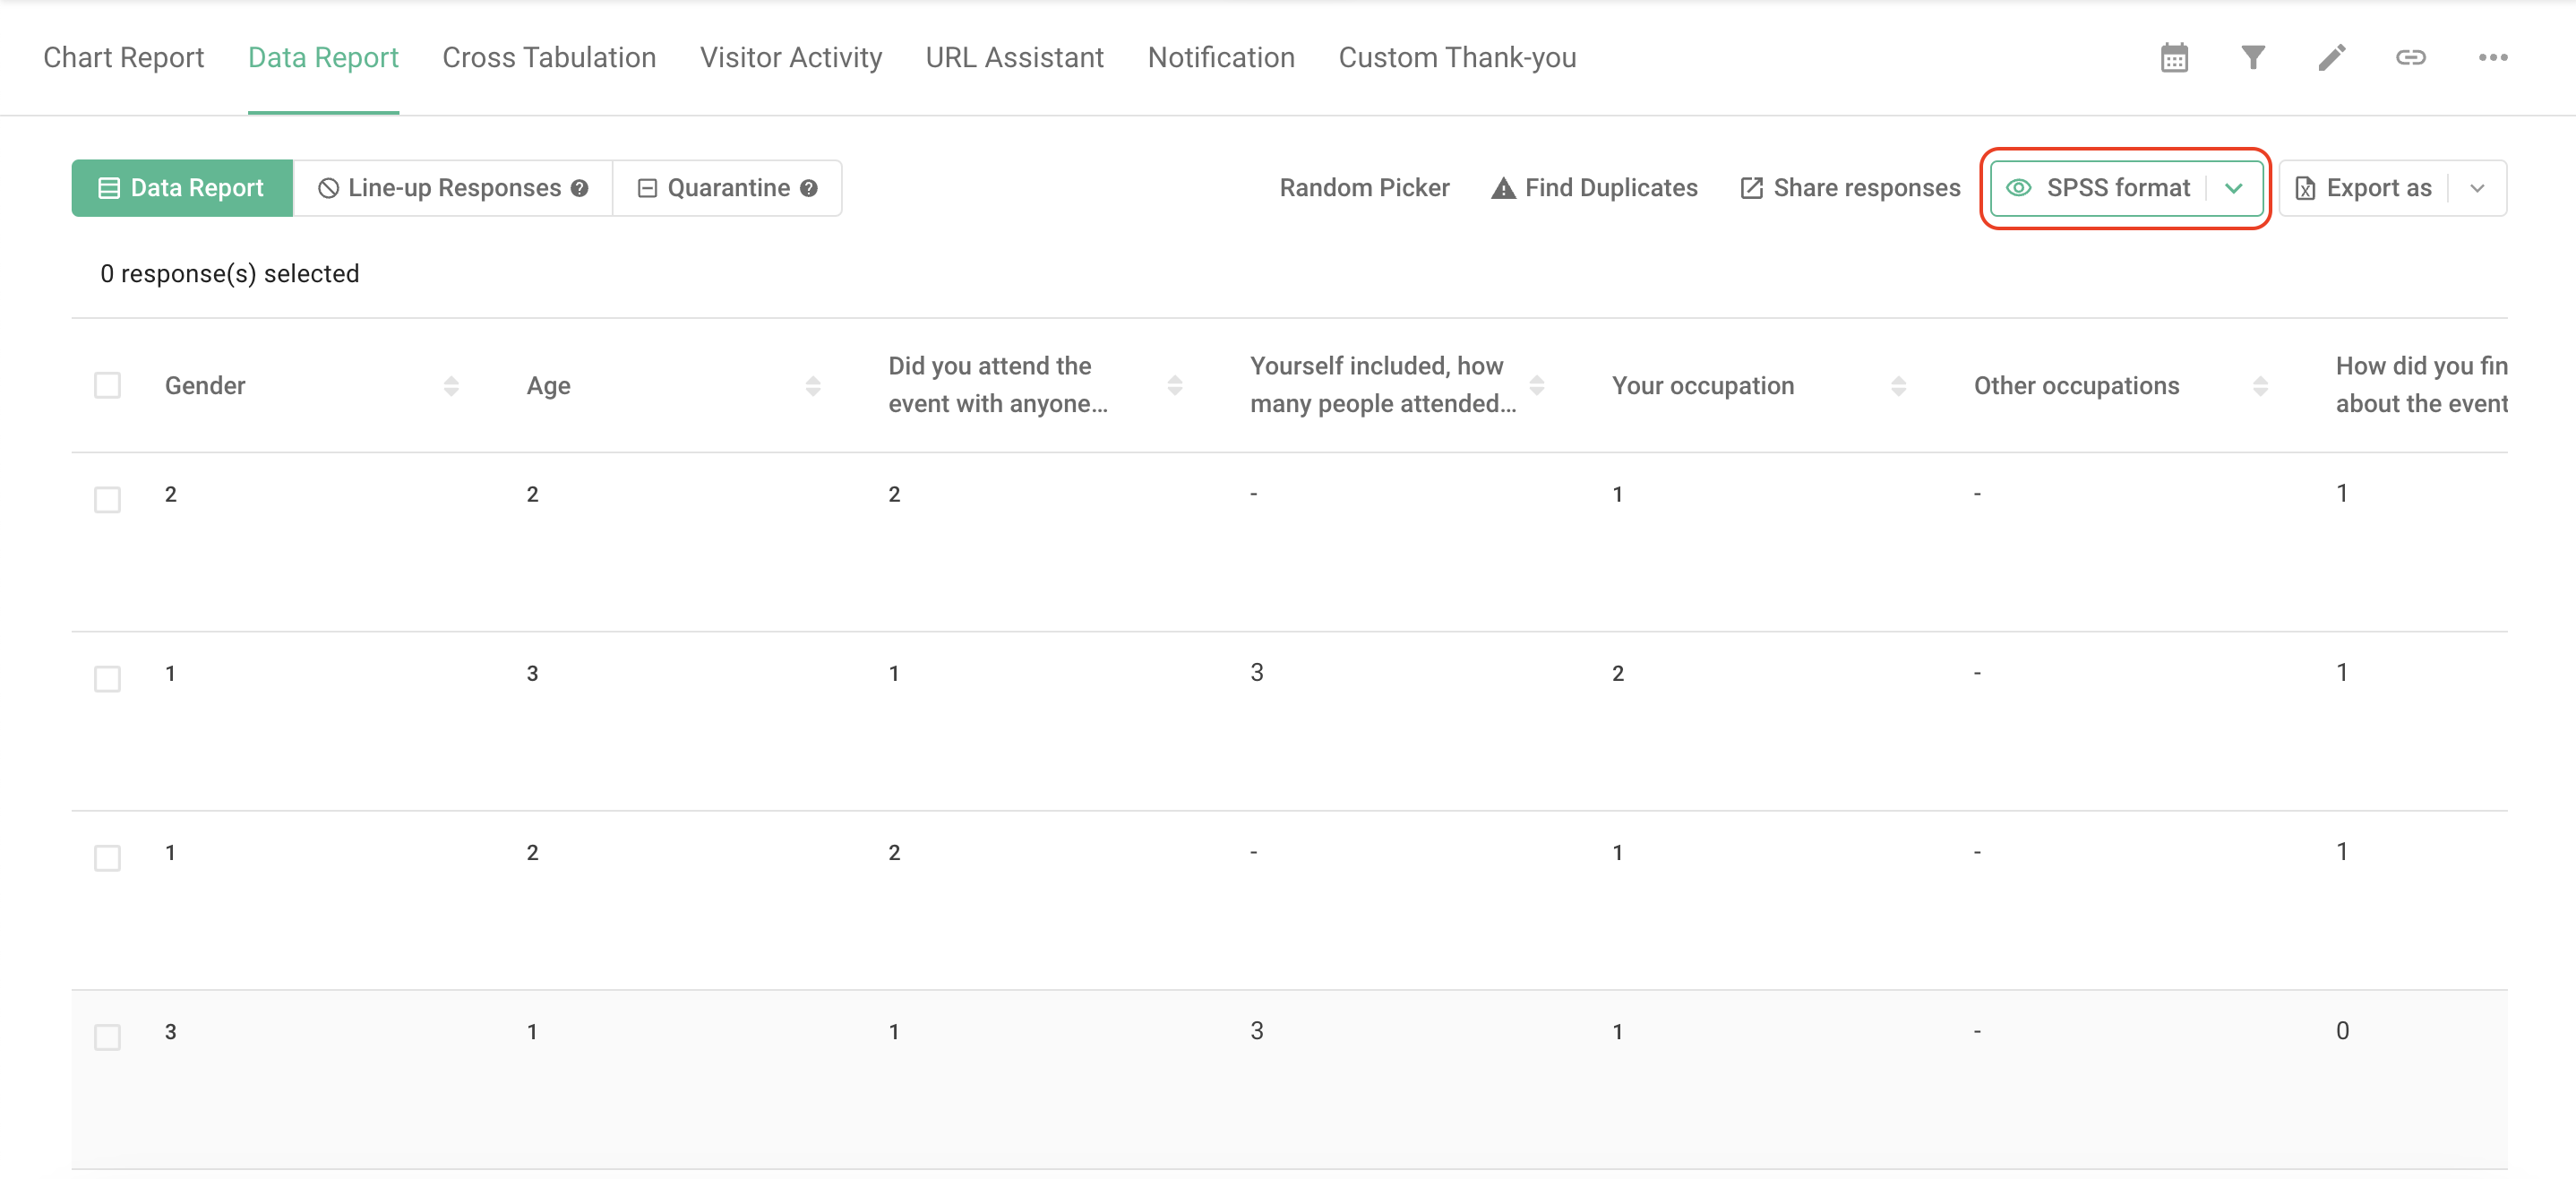
We will convert response data into a format compatible with SPSS software (converting all answers except text-based ones into numeric representations), enabling advanced analysis directly within SPSS.
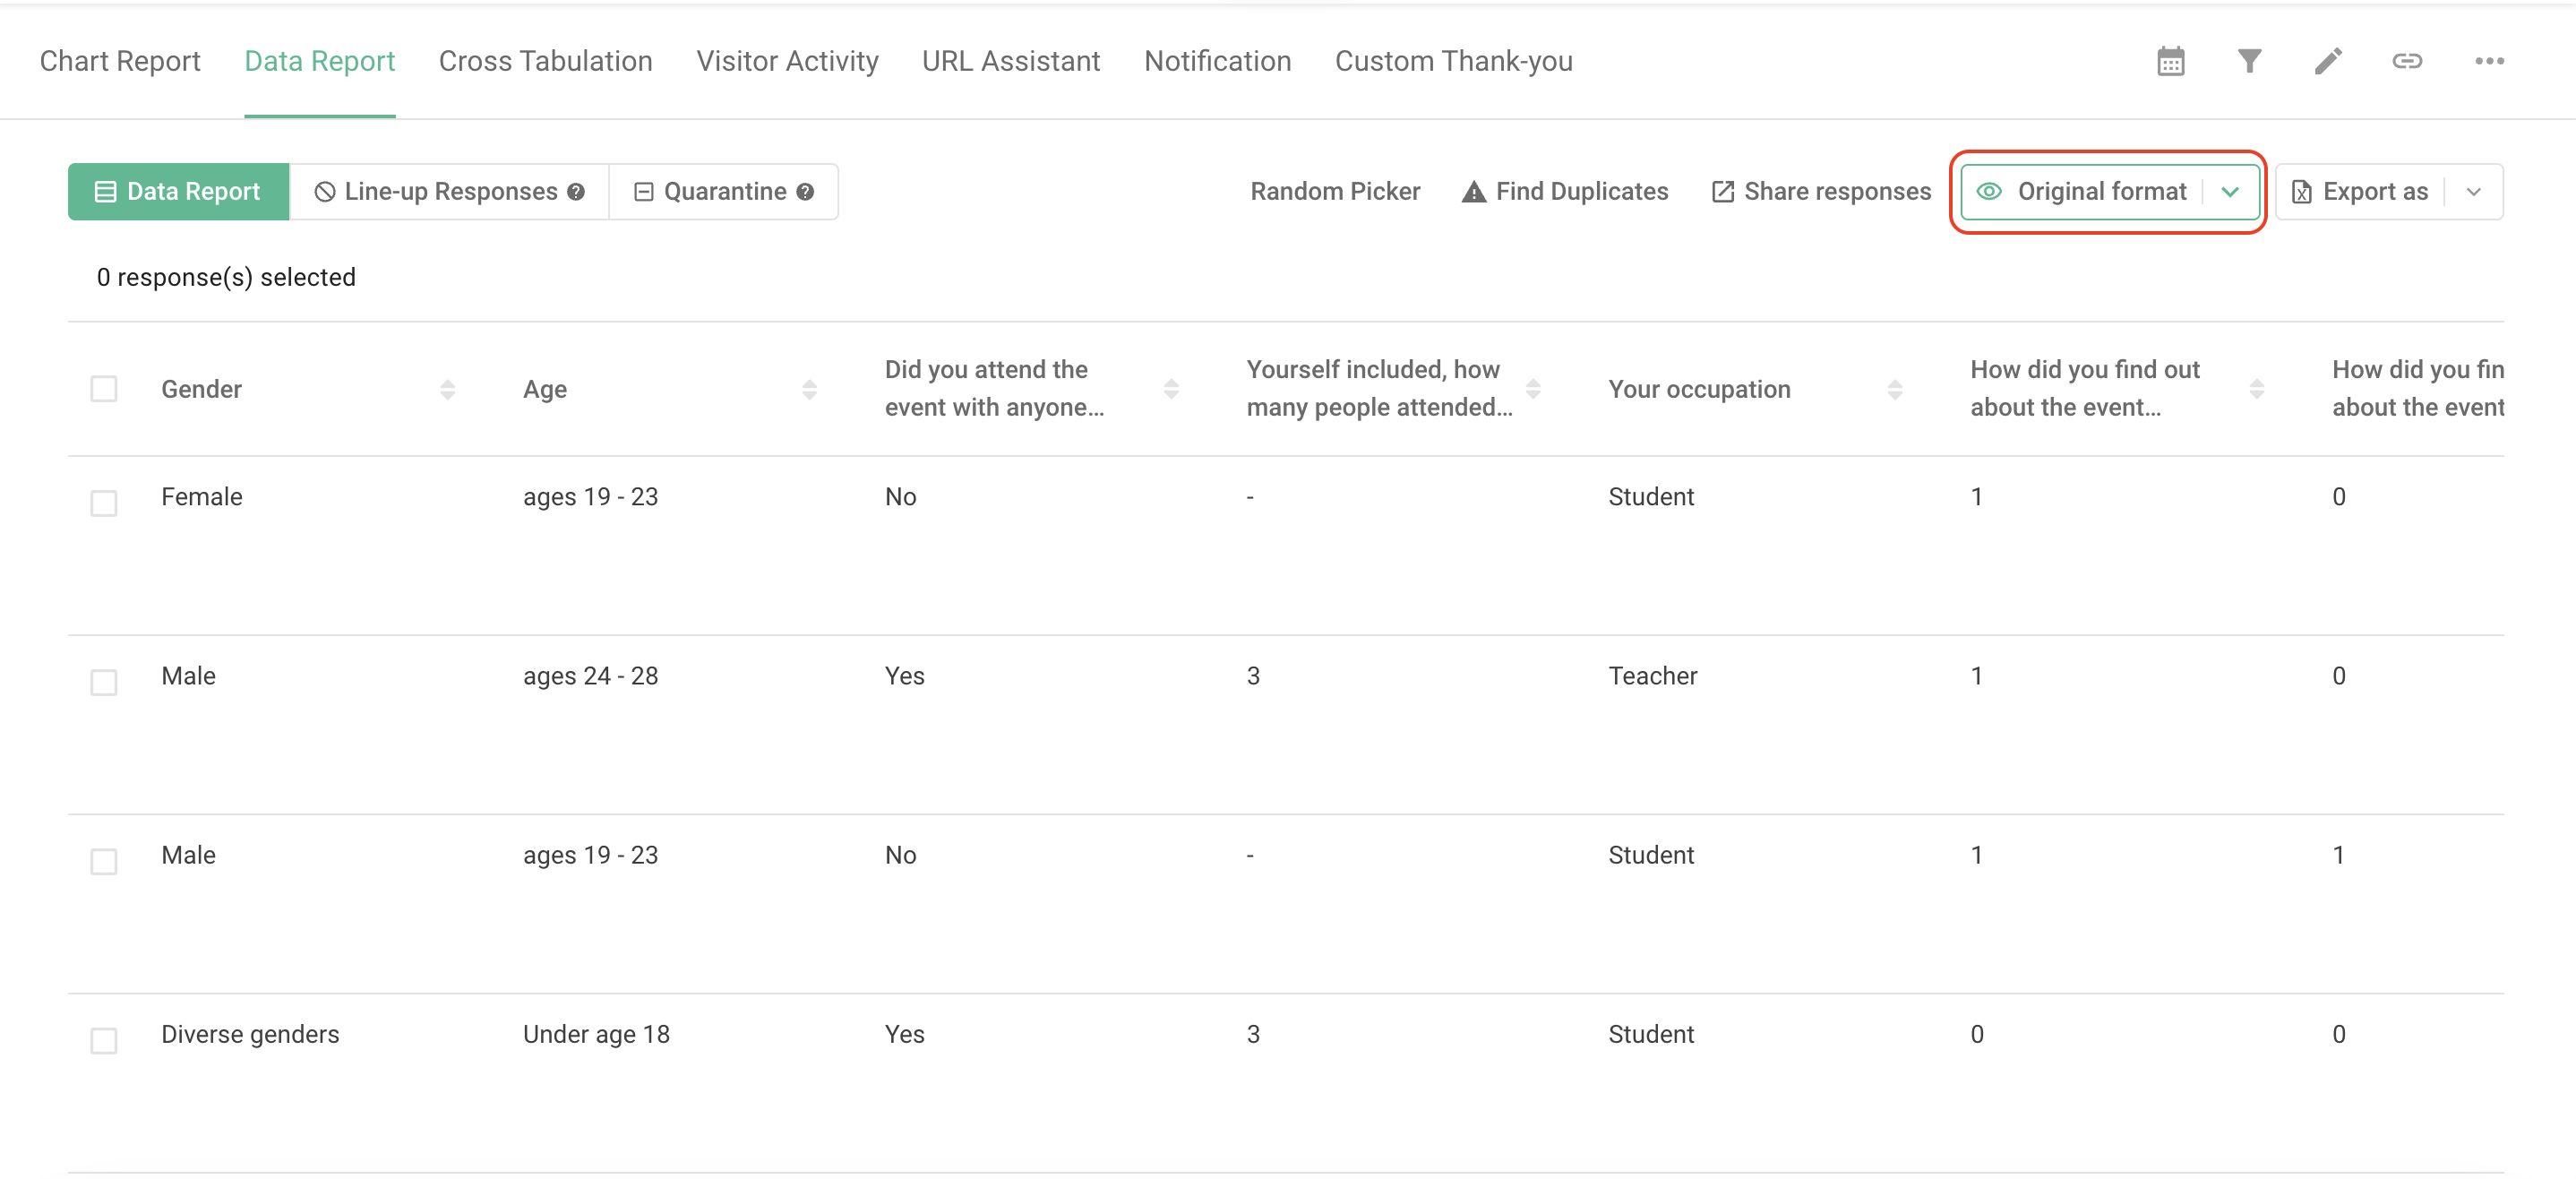
In original format, these three question types : Checkboxes、Ranking、Selection Based that have multiple possible answers will be presented in and Excel format makes them easier to analyse.
For checkboxes and selection-based questions, the choices are represented using numeric values, 1 and 0, to indicate whether each option was selected (1 for selected, 0 for not selected). In the case of ranking questions, the results are presented column by column based on the respondent's ranking.
8. Export as
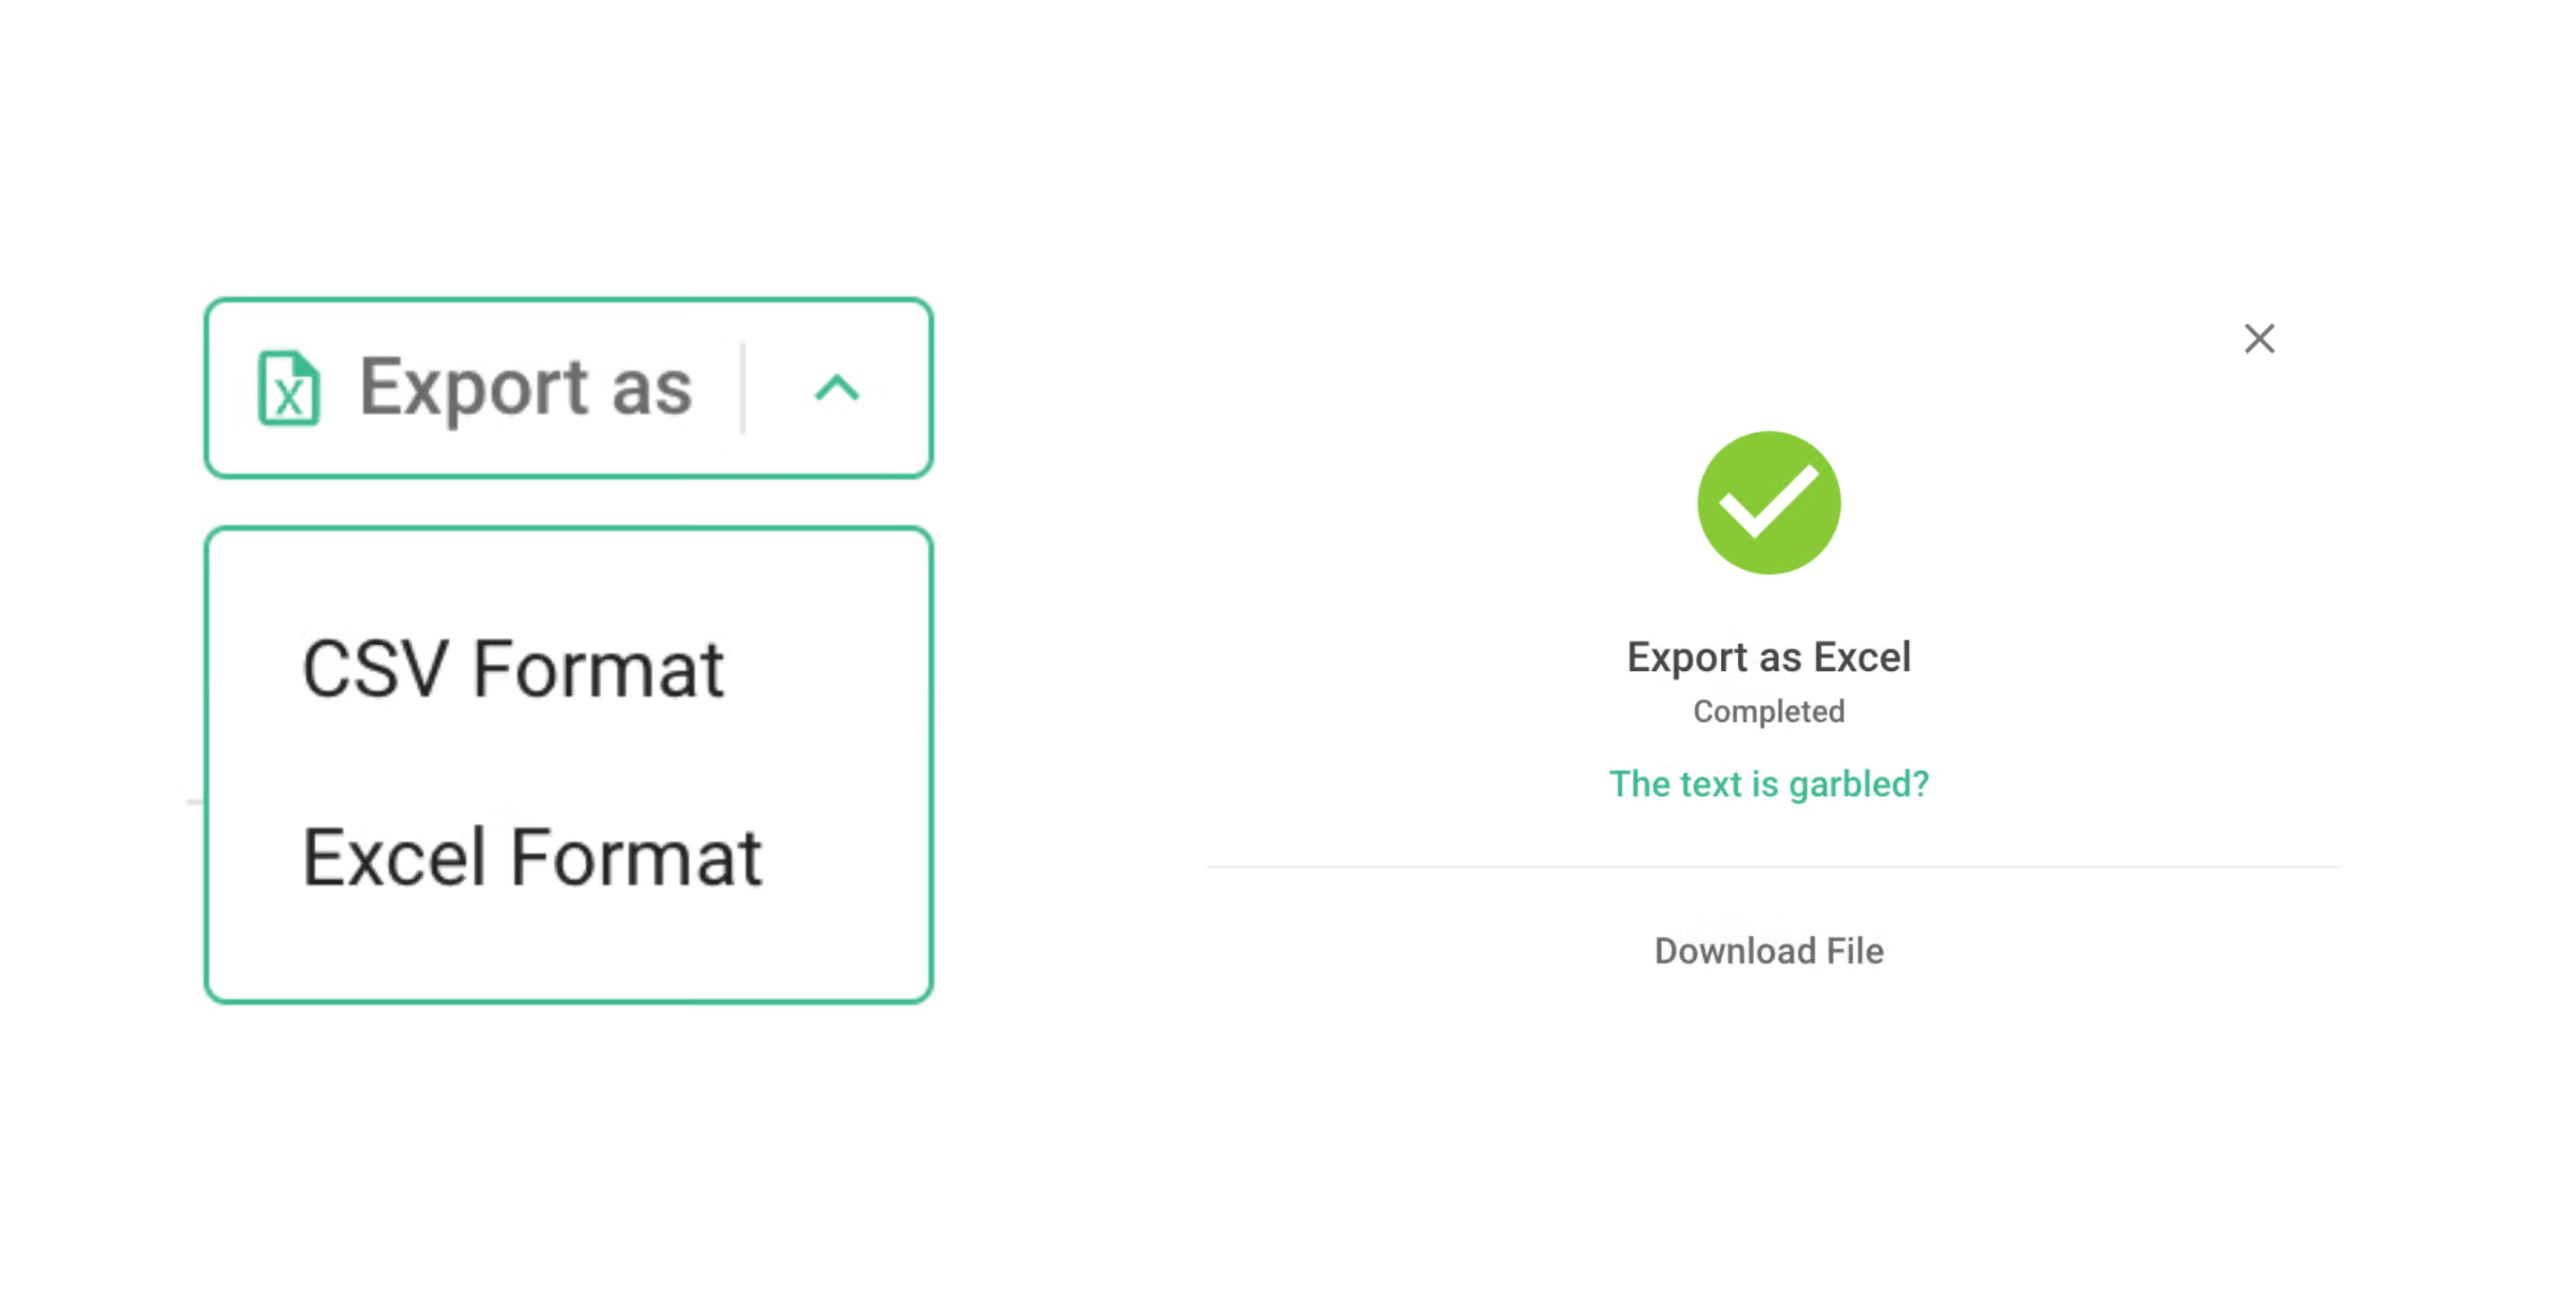
You can export your detailed survey results into either CSV format or Excel format for further application or backup. Simply select your desired format, and you will obtain the corresponding CSV file or Excel file.
9. Edit notes
You can add additional information or notes to individual or multiple response data at any time.
10. Put it into Quarantine
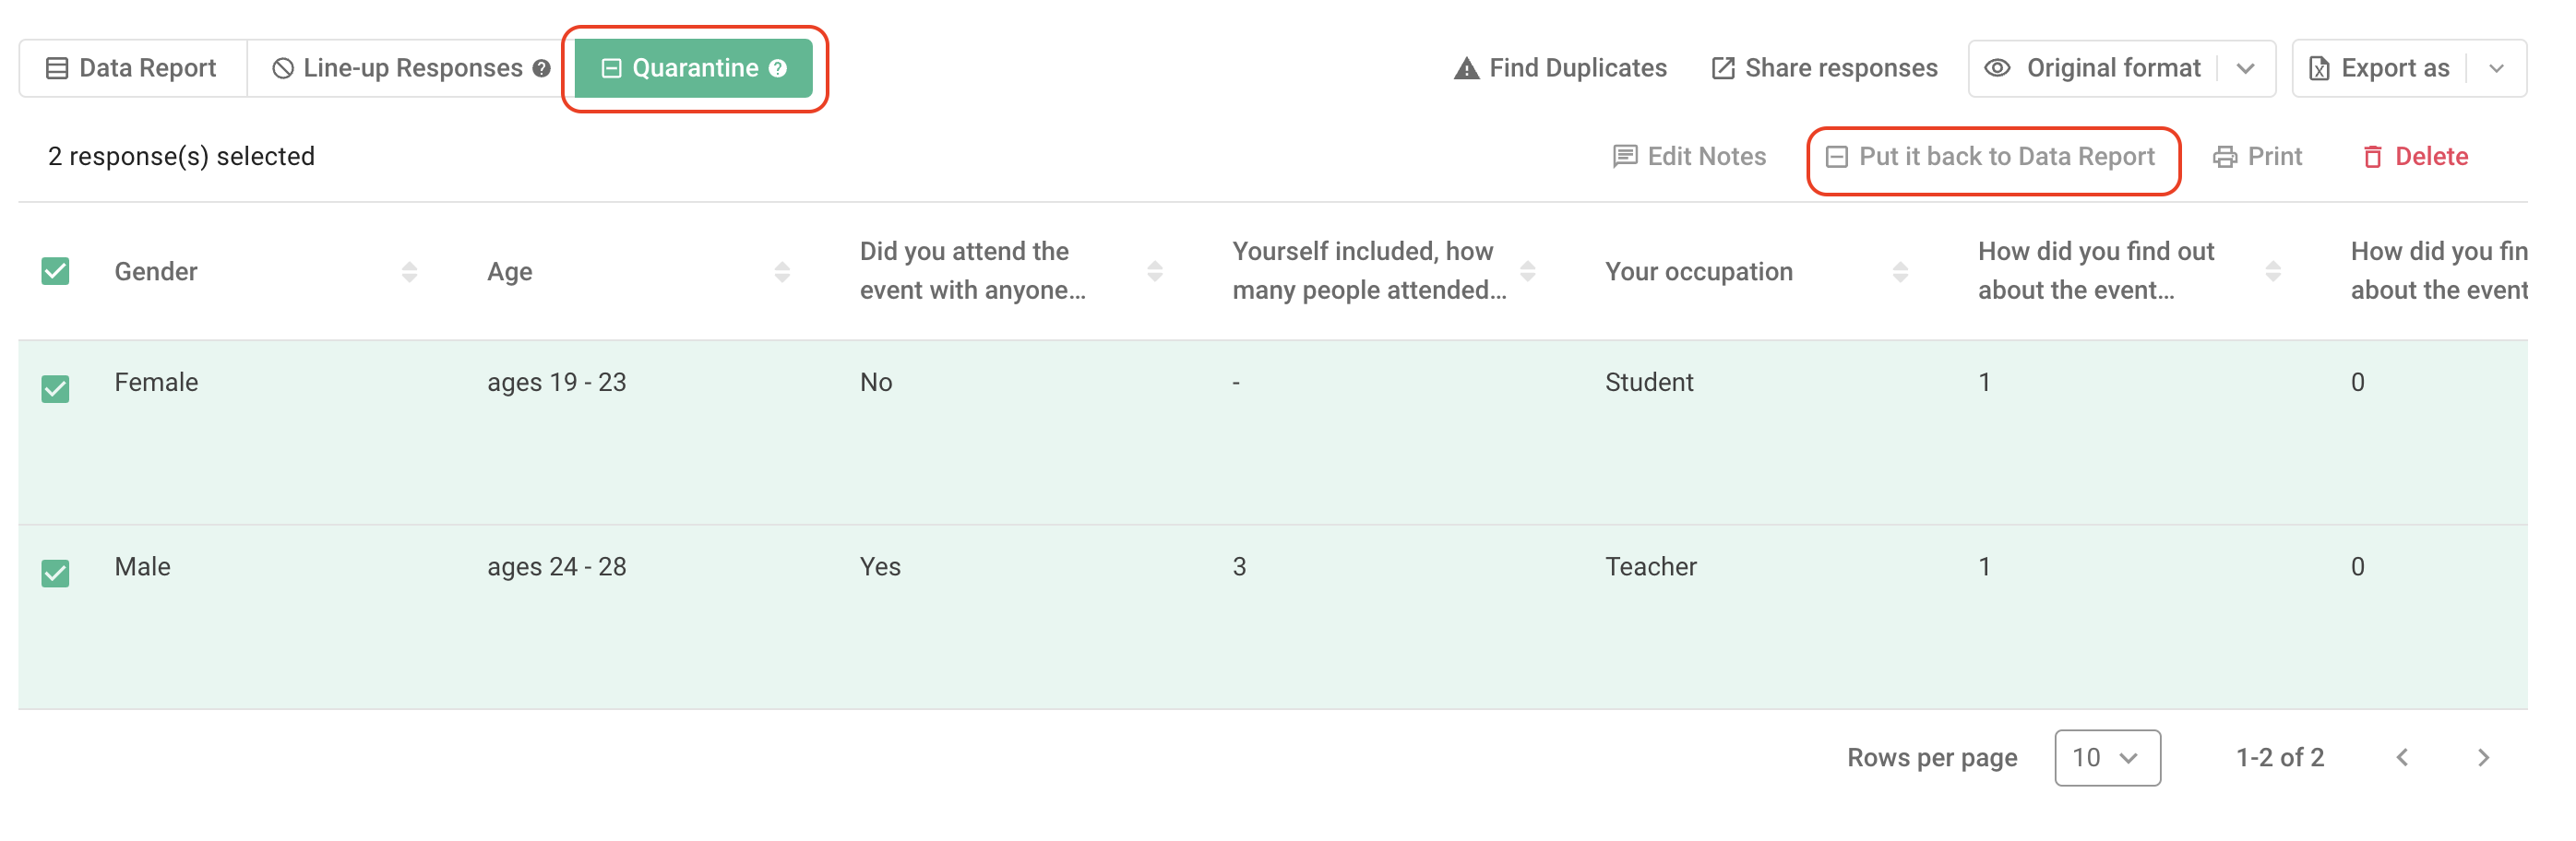
If you wish to separate specific data from the general Data Report without deleting it, you can temporarily move that data to the Quarantine area.
Later, if you want to include that data back in the Data Report, simply select it in the Quarantine area, and then click the "Put it back to Data Report" button in the upper right corner.
11.Print
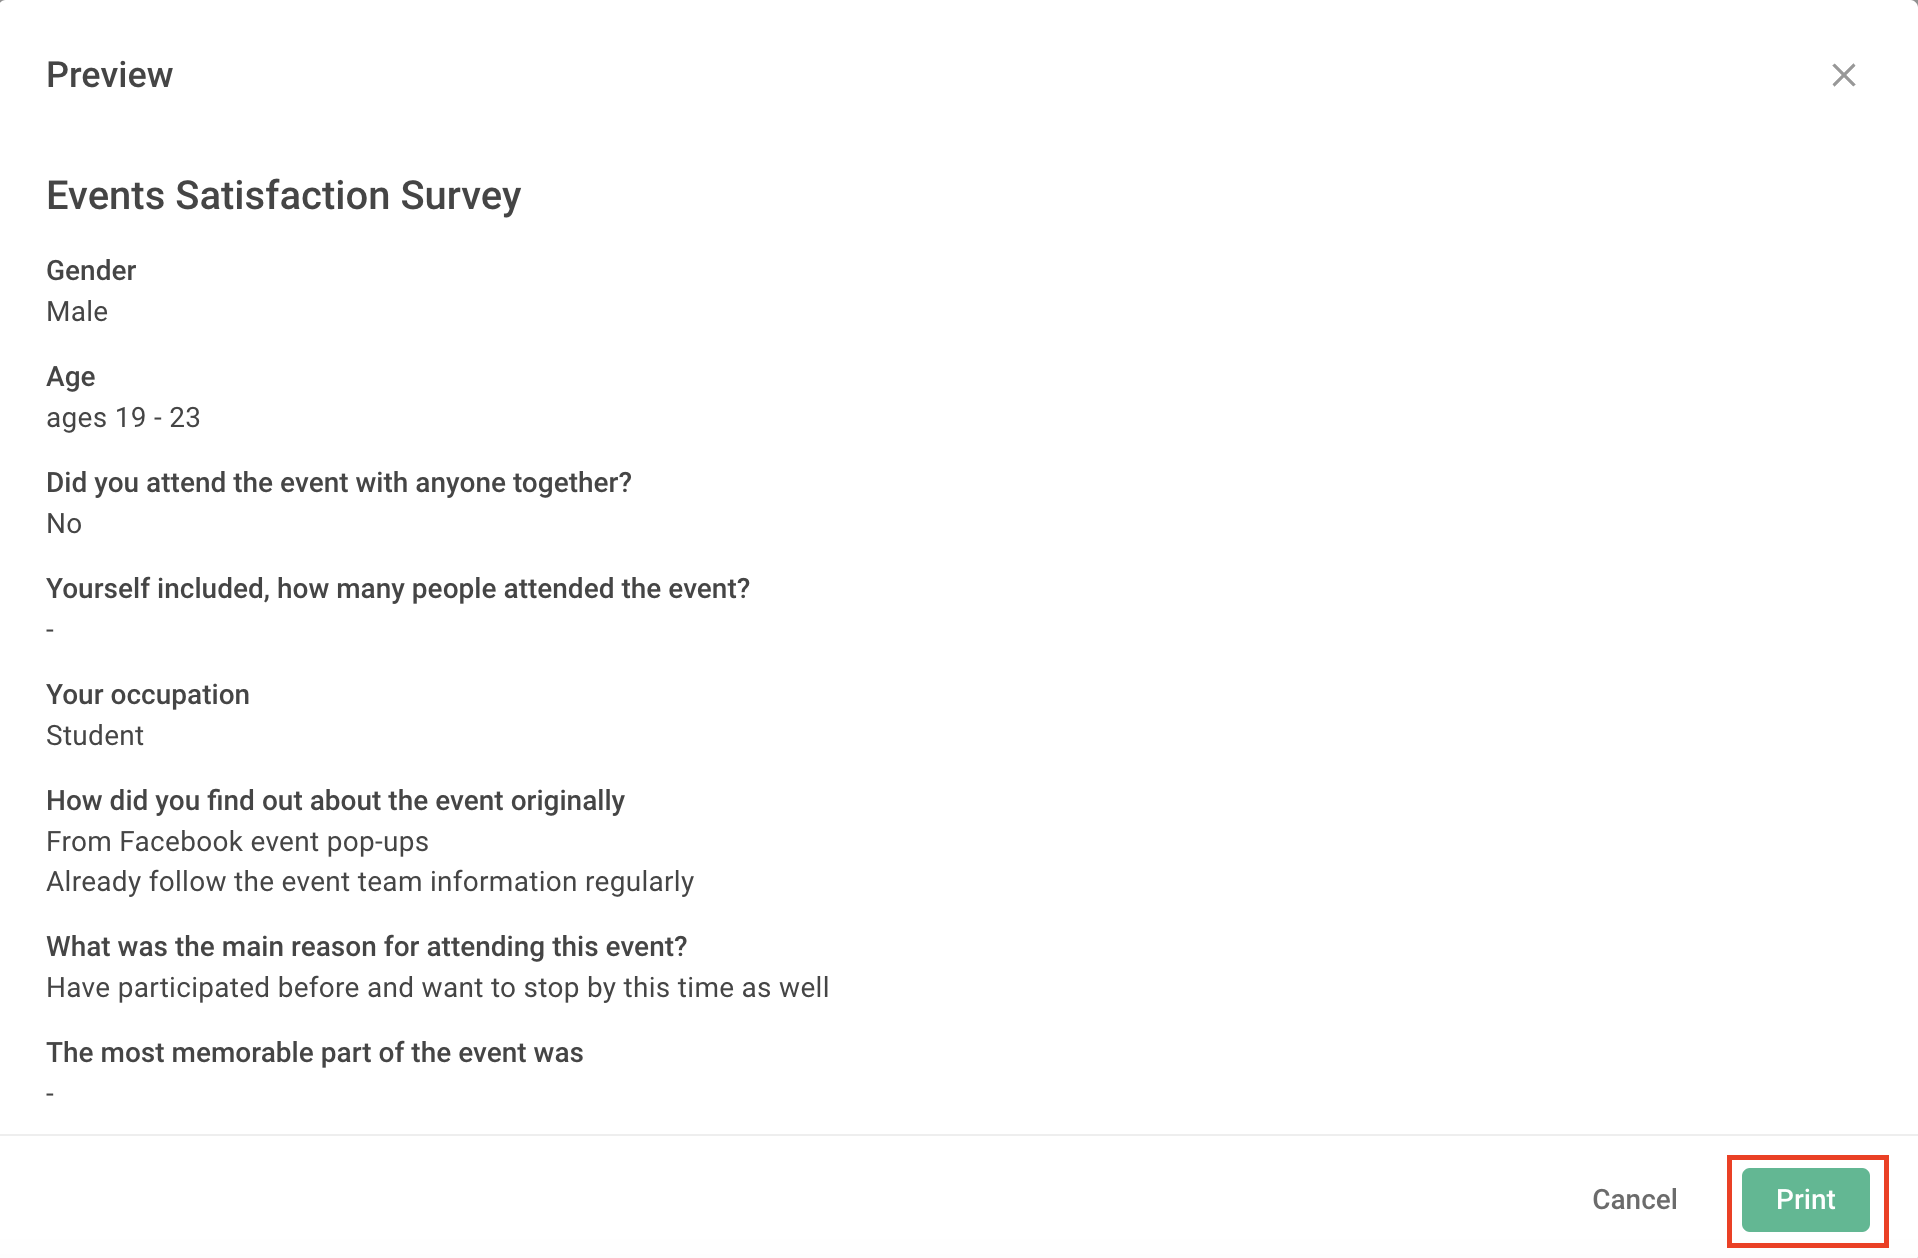
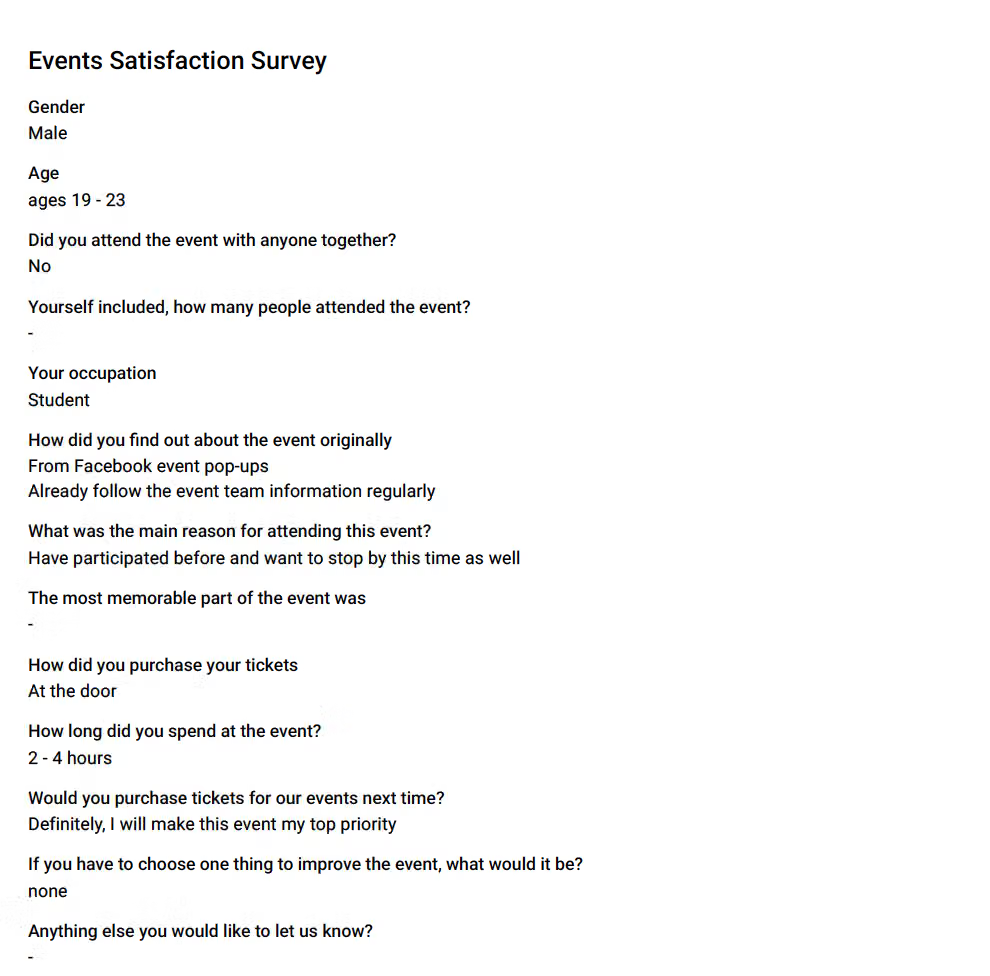
You can present individual or multiple survey responses in a vertical format, making it easy to print or export for further use.
12. Delete
If you wish to delete one or more survey responses, simply select the data you want to delete and then click the "Delete" button.
Notice : The deleted response(s) CANNOT be recovered.
FAQs
It happened due to Excel's limitations and is not a malfunction of the Data Report feature.
Excel automatically converts digits beyond 15 characters into zeros when handling long numbers (you can refer here for further explanation). To address this problem, you can consider one of the following methods:
It is more likely caused by the volume of data that you are exporting.
Therefore, if you expect that your export data will exceed 180,000 records, it is recommended that you use filtering or date filtering functions to reduce the number of records exported each time, and then export them in batches!
In general, as long as the respondent completes filling out the survey, presses the "Submit" button, and enters the thank-you page, it means that the survey response(s) has been successfully recorded. Therefore, you can instantly see the response data in the Data Report.
However, if you are certain that the respondent has indeed submitted the survey but you cannot see their response in the Data Report, it may be due to one of the following reasons:
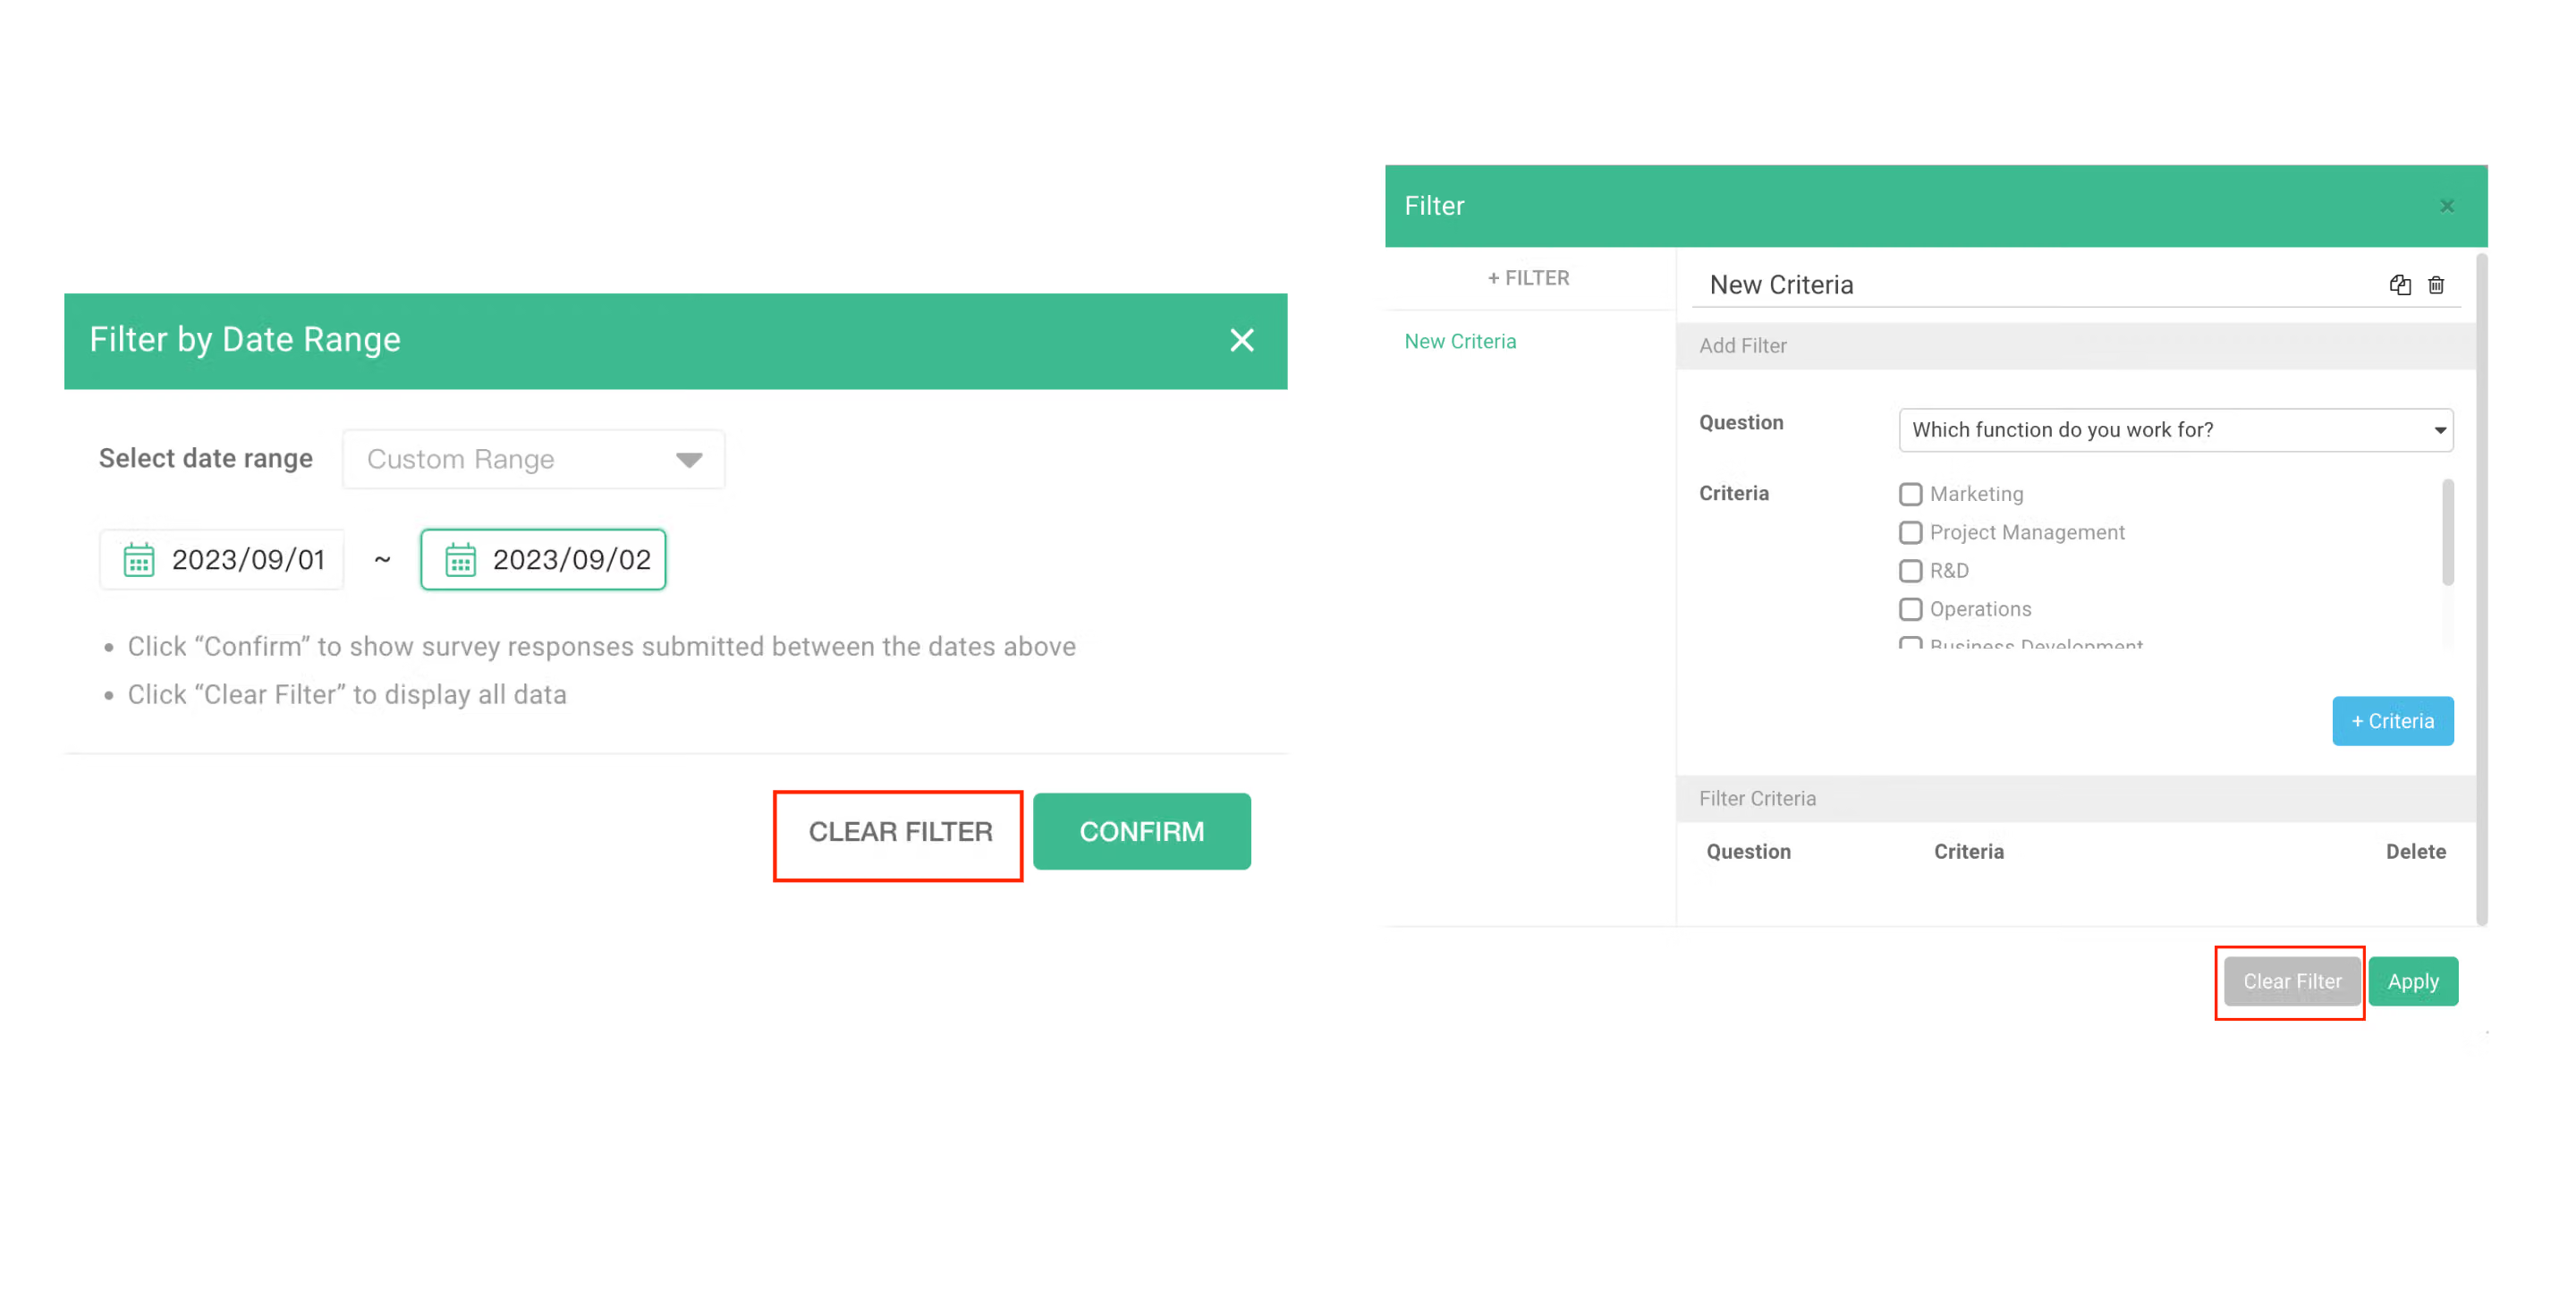
Since the Date Filter and Filter are automatically saved, if you haven't cleared any previous filters you've set, when you access the Data Report, it will display the response(s) that match those filters, not all of your survey response(s).
Therefore, you can simply go into the Date filter or Filter settings and click "Clear Filters" button to remove the filter and view all unfiltered data!
If your survey has any of the "Responses Quality" features enabled (e.g.,Isolate By Response Time, Isolate Duplicates, or reCAPTCHA ), then you have actually received the data. However, the system has recognized it as invalid data and placed it in the Quarantine area, which is why it doesn't appear in the Data Report.
In this case, you need to go to the Quarantine area, select the data you want to move back to the Data report, and click "Put back to Data Report" button in the upper right corner.
It's possible that you have multiple surveys with similar titles, and you entered the Data Report of the survey that the respondent did not submit.
Make sure that you access the correct survey's Data Report to review the respondent's submitted response.
Please ensure that you share the official survey link, not the preview mode link. The preview mode is only for testing purposes and cannot collect real responses.
Please go to the Account Setting and check if you are currently on the BASIC plan or not. If your current plan is BASIC, it is likely that the surveys you created had utilized PRO features while subscribing to PRO plan. After cancellingcanceling your subscription, you will not be able to view the responses collected through PRO features. If you want to view new responses, you can simply resubscribe to the PRO plan.
For more information, please refer to the Cancel Subscription.
Data Report provides easy data filtering and export for further analysis or data storage.